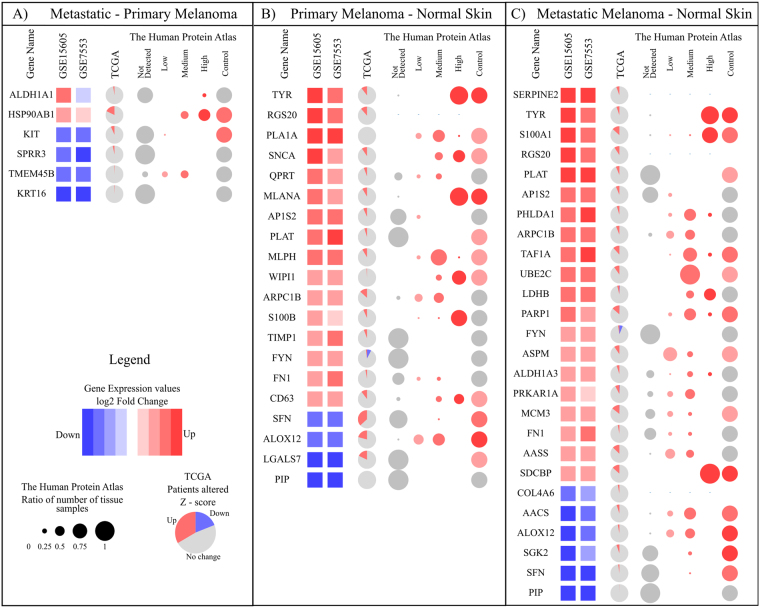
Figure 3.
Final signature genes for 3 condition comparisons. (A) 6 genes of MM vs. PM (B) 20 genes of PM vs. NS (C) 25 of MM vs. NS. The first two columns after gene name show the differential expression level in cohort GSE15605 and GSE7553, respectively. Third column show Venn diagrams indicating percentage of patients, the gene is differentially regulated in TCGA based on z-score. In the human protein atlas section, first four columns show the antibody stain levels observed in melanoma tissue. The size of each circle is based on a ratio of the number of patients showing particular expression to the total patients and the colouring is based on the intensity of expression. The last column is stain intensity in control tissue.

