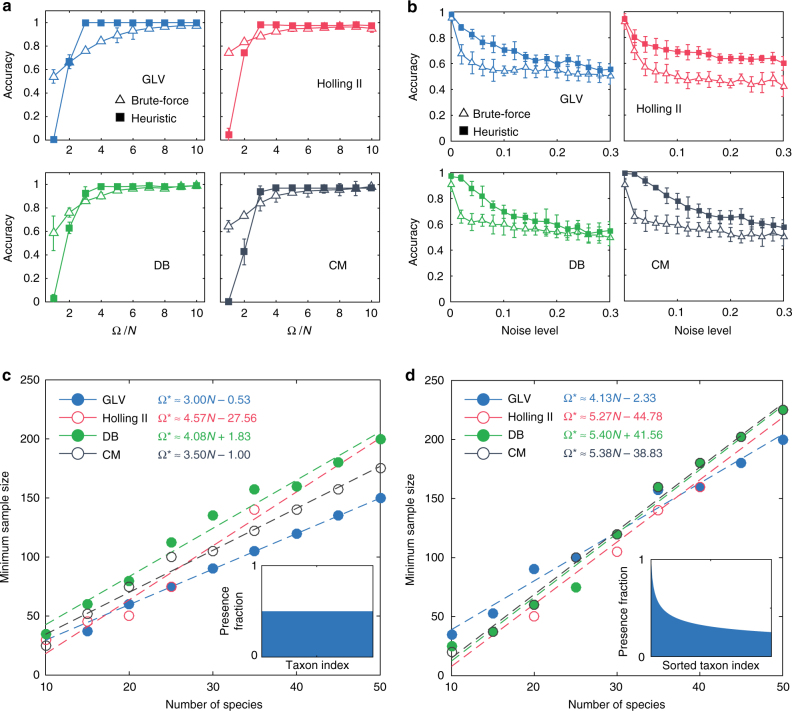
Fig. 3.
Validation of our method in inferring interaction types using simulated data. a,b Consider a small microbial community of taxa. We generate steady-state samples using four different population dynamics models: Generalized Lotka–Volterra (GLV), Holling Type II (Holling II), DeAngelis–Beddington (DB), and Crowley–Martin (CM). We compare the performance of the brute-force algorithm (with solution space ~) and the heuristic algorithm (with solution space ~). a In the noiseless case, we plot the inference accuracy (defined as the percentage of correctly inferred signs in the Jacobian matrix) as a function of sample size Ω. b In the presence of noise, we plot the inference accuracy as a function of the noise level η. Here the sample size is fixed: . The error bar represents standard deviation for 10 different realizations. c, d We calculate the minimal sample size required for the heuristic algorithm to achieve high accuracy (100% for GLV, 95% for Holling II, DB, and CM) at different system sizes. We consider two different taxa presence patterns: uniform and heterogenous (see insets). Here the simulated data is generated in the noiseless case and we chose . a–d The underlying ecological network is generated from a directed random graph model with connectivity 0.4 (i.e., with probability 0.4 there will be a directed edge between any two taxa)

