Fig. 5.
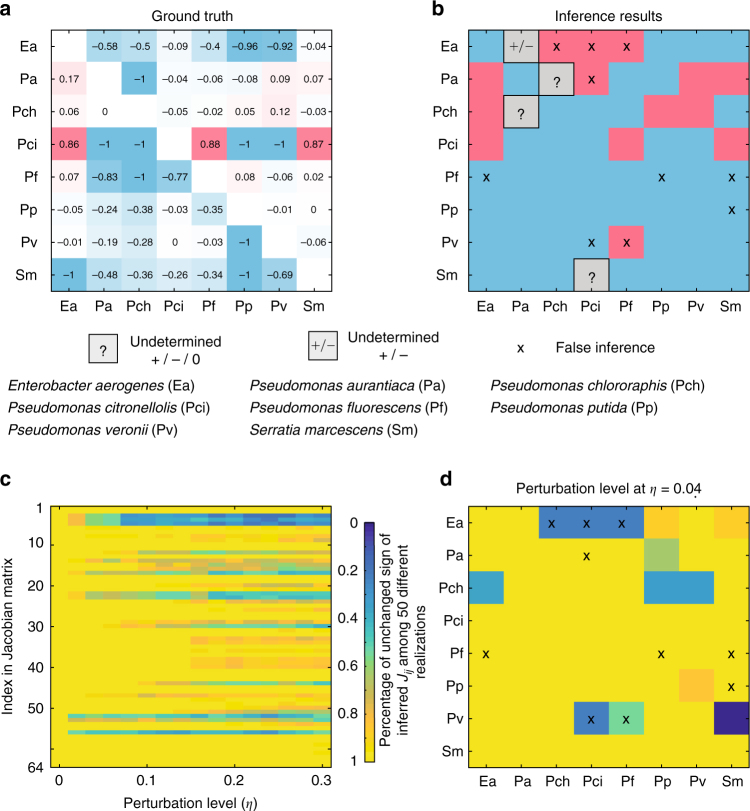
Inferring interaction types of a synthetic soil microbial community. The steady-state samples were experimentally collected from a synthetic soil microbial community of eight bacterial species. Those steady-state samples involve 101 different species combinations: all eight solos, 28 duos, 56 trios, all eight septets, and 1 octet. a From the eight solos (monoculture experiments) and 28 duos (pair-wise co-culture experiments), one can calculate the relative yield R ij, quantifying the promotion (positive) or inhibition (negative) impact of species j on species i. The values shown in the relative yield matrix quantify the strengths of promotion and inhibition effects. The sign-pattern of this matrix serves as the ground truth of that of the Jacobian matrix associated with the unknown population dynamics of this microbial community. b Without considering the 8 solos and 28 duos, we analyze the other steady-state samples. We use the brute-force method to infer the ecological interaction types, i.e., the sign-pattern of the Jacobian matrix. Blue (or red) means inhibition (or promotion) effect of species j on species i, respectively. 10 signs (labeled by ‘×’) are falsely inferred, four signs (gray) are undetermined by the analyzed steady-state samples. c, d The robustness of the inference results in the presence of artificially added noise: , where the random number u follows a uniform distribution , and η is the noise level. At each noise level, we run 50 different realizations. Yellow (or blue) means many (or few) inferred J ij keep the same sign among 50 different realizations. c. Many of the inferred J ij keep their signs in the presence of noise up to noise level . d At , we plot the percentage of unchanged signs for inferred Jacobian matrix in 50 different realizations. The ‘×’ labels correspond to the 10 falsely inferred signs shown in b. Five of the 10 falsely inferred interactions change their signs frequently even when the perturbation is very small, implying that the falsely inferred signs in b could be due to measurement noise in the experiments

