Abstract
The aim of the present study was to explore the effects of oxidative stress induced by CoCl2 and H2O2 on the regulation of bioenergetics of esophageal squamous cell carcinoma (ESCC) cell line TE-1 and analyze its underlying mechanism. Western blot results showed that CoCl2 and H2O2 treatment of TE-1 cells led to significant reduction in mitochondrial respiratory chain complex subunits expression and increasing intracellular reactive oxygen species (ROS) production. We further found that TE-1 cells treated with CoCl2, a hypoxia-mimicking reagent, dramatically reduced the oxygen consumption rate (OCR) and increased the extracellular acidification rate (ECAR). However, H2O2 treatment decreased both the mitochondrial respiration and aerobic glycolysis significantly. Moreover, we found that H2O2 induces apoptosis in TE-1 cells through the activation of PARP, Caspase 3, and Caspase 9. Therefore, our findings indicate that CoCl2 and H2O2 could cause mitochondrial dysfunction by up-regulation of ROS and regulating the cellular bioenergy metabolism, thus affecting the survival of tumor cells.
Keywords: bioenergetics, esophageal squamous cell carcinoma, hypoxia, mitochondria, oxidative stress, reactive oxygen species
Introduction
Esophageal squamous cell carcinoma (ESCC) is the most frequent histological subtype of esophageal cancer and is the sixth most common cause of cancer-associated mortality worldwide [1]. Despite advances in early diagnosis, surgery, and chemoradiotherapy, the prognosis of ESCC is still very poor and remains a challenge [2]. Thus, our understanding of mechanisms of ESCC tumorigenesis is urgent, which will facilitate the development of diagnosis marker and novel therapeutic strategies.
Unlike normal cells, tumor cells demand a vast amount of energy (ATP) and metabolites to support their rapid proliferation. Indeed, some tumor cells are addicted to glycolysis rather than oxidative phosphorylation (OXPHOS) even in normoxic conditions and need quick reprogramming of energy metabolism. This phenomenon is often referred to as the Warburg effect [3]. Importantly, glycolysis provides cancer cells with not only energy but also crucial intermediates for biosynthesis of macromolecules, lipids as well as NADPH which is important for redox homeostasis. Metabolic reprogramming is required for cell malignant transformation, tumorigenesis, invasion, metastasis, and resistance to cancer treatments [4]. In solid tumor, hypoxia is a crucial microenvironmental stimuli that leads to significant up-regulation of hypoxia-inducible factor-1α (HIF-1α) in majority of human cancers [5–7]. Cobalt chloride (CoCl2), a well-known hypoxia-mimicking agent in vitro, which blocks HIF-1α degradation and thus causes HIF-1α accumulation in cells, therefore leading to an intracellular hypoxia-like microenvironment and enhancing tumor malignancy.
Because hydrogen peroxide (H2O2) can generate large amounts of oxygen free radicals and cause oxidative stress in tumor cells, it is widely used as an apoptosis inducer [8]. Indeed, many anticancer drugs promote cancer cell death through enhancing the intracellualr H2O2 generation [9,10].Thus, studying the effects of H2O2 on cancer cells is helpful to provide novel strategies for the prevention and treatment of cancers.
H2O2 is also an important signaling molecule in tumor cells, which can regulate cell signaling pathways and transcription factors at different levels [11,12]. For example, H2O2 can induce the activation of EGFR, which leads to the amplification of Ras signaling cascade and activation of mitogen-activated protein kinases (MAPKs) [13]. Moreover, H2O2 can indirectly regulate PTK-EGFR-Ras signaling in cancer cells, and finally the activation of MAPK, so that ERK, JNK, p38, three subfamilies signaling pathways are regulated [13,14].
Low concentration of H2O2 plays an essential role in regulating cell division and growth as a signaling molecule [15,16]; however, when the amount of H2O2 exceeds a certain critical value, the cell cycle will be blocked and even lead to apoptosis [17]. Therefore, the up-regulation of H2O2 amount in tumor cells is one of the strategies to kill tumor cells. This process can also be rescued by up-regulation of catalase expression. Overexpression of SOD inhibits tumor cell proliferation, metastasis, and other malignant phenotypes. Similarly, catalase or glutathione reductase can reverse the antitumor effect of SOD [18].
In the present study, we examined the effects of CoCl2-induced hypoxia and H2O2 on the regulation of cellular bioenergy metabolism in ESCC cells and sought to investigate the underlying molecular mechanism.
Materials and methods
Reagents and antibodies
RPMI-1640 medium and FBS (Life Technologies, Grand Island, NY); oligomycin, FCCP, rotenone, antimycin A, glucose, 2-DG, and CoCl2 were purchased from Sigma (St. Louis, MO); Annexin V-FITC/propidium iodine (PI) apoptosis detection kit was from BD Pharmingen (San Diego, CA); 2′,7′-dichlorodihydrofluorescein diacetate (DCFH-DA), horseradish peroxidase (HRP) conjugated anti-rabbit, anti-mouse Ig, trypsin were from Beyotime (Shanghai, China). The following antibodies were used: anti-COXI, anti-COXII, anti-COXIV, and anti-SDHA (Abcam, Cambridge, MA); anti-ND2, anti-NDUFA5, anti-NDUFA6, anti-NDUFA9, anti-HIF-1α, anti-ATP5A, anti-PARP, anti-Caspase-9, anti-Caspase-3, anti-cleaved Caspase-3 (Cell Signaling, Beverly, MA); anti-β-actin (Abmart, Shanghai, China); anti-Cyt. b (Santa Cruz Biotechnology, Santa Cruz, CA). All other chemicals used were of highest analytical grade and obtained from Sigma, unless otherwise stated.
Cell lines and culture conditions
The human ESCC cell line TE-1 was obtained from the Cell Bank of the Chinese Academy of Sciences (Shanghai, China). TE-1 cells were cultured in RPMI-1640 medium supplemented with 10% FBS and antibiotics (100 units/ml penicillin and 100 μg/ml streptomycin) at 37°C with 5% CO2.
Determination of alterations in cell morphology and cell number
TE-1 cells were plated in 60-mm dishes at a density of 0.3 × 10⁶ and incubated with series concentrations of H2O2 for 24 h at 37°C with 5% CO2. Inverted microscopy (Nikon, Tokyo, Japan) was used to examine the alterations in cell morphology and cell number.
FACS analysis for intracellular ROS
Cells were harvested by trypsin, washed with PBS, and incubated with DCFH-DA at a final concentration of 10 µM in RPMI-1640 medium for 30 min at 37°C, then cells were washed three times with cold PBS. Intracellular reactive oxygen species (ROS) levels were measured as described previously by using the fluorescence probe DCFH-DA according to the manufacturer’s protocol (Beyotime, Shanghai, China) [19]. The excitation wavelength for DCF fluorescence is 488 nm and the emission wavelength for DCF fluorescence is 525 nm, respectively.
FACS analysis for apoptosis
Harvested cells were washed with cold PBS twice, and incubated with 1× binding buffer at a concentration of 1 × 10⁶ cells/ml. Annexin V-FITC/PI (BD, San Jose, CA) was added, followed by incubation in the dark at room temperature for 20 min. Four hundred microliters of 1X binding buffer was added to each tube. The samples were analyzed by flow cytometry within 1 h.
Immunoblotting
Cells were washed with cold PBS and lysed in RIPA lysis buffer supplemented with protease and phosphatase inhibitors on ice for 20 min, followed by centrifugation at 13000 rpm for 20 min at 4°C, and the supernatants were collected. Protein concentrations of whole cell extracts were determined using the Pierce BCA protein assay kit. Cell extracts equivalent to 20 µg total protein were resolved in 10% SDS/PAGE gels followed by electrophoretic transfer on to nitrocellulose membrane (Bio–Rad, Hercules, CA) in Tris-glycine buffer. Blots were blocked at room temperature for 2 h in 3% non-fat milk in TBS-Tween (TBS-T) on a shaker, and then incubated with the primary antibodies overnight at 4°C. The membrane was washed in TBS-T for at least 3× forw 10 min and then incubated with HRP conjugated anti-rabbit or anti-mouse IgG at room temperature for 1 h with gentle shaking. Signal was detected using ECL according to the manufacturer’s protocol (Thermo Scientific, Rockford, IL) and exposed to X-ray films. β-actin was used as control for equal loading and the optical density was measured using National Institute of Health ImageJ software. Each experiment was repeated at least three times.
RNA preparation and quantitative real-time PCR analysis
Total RNAs were extracted from cells using TRIzol reagent (Life Technologies, Carlsbad, CA) following manufacturer’s instructions. cDNA was synthesized from 2 μg purified total RNA using the PrimeScript™ RT reagent Kit with gDNA Eraser (Takara, Dalian, China). Quantitative real-time PCR (qRT-PCR) was performed as described previously [19] using gene-specific primers. The results were normalized to β-actin in the same samples. Each sample was analyzed in triplicate and repeated three times. The primer sequences used were as follows: COXI 5′-TCCGCTACCATAATCATCGCT-3′ (forward), 5′-CCGTGGAGTGTGGCGAGT-3′ (reverse); COXII 5′-CGACTACGGCGGACTAATCT-3′ (forward), 5′-TCGATTGTCAACGTCAAGGA-3′ (reverse); COXIV 5′-GCAGTGGCGGCAGAATG-3′ (forward), 5′-AGTCTTCGCTCTTCACAACA-3′ (reverse); ATPase6 5′-CTGTTCGCTTCATTCATTGC-3′ (forward), 5′-AGTCATTGTTGGGTGGTGAT T-3′ (reverse), ATPase8 5′-AAACTACCACCTACCTCCCTCAC-3′ (forward), 5′-GCAATGAATGAAGC ATTCATTGC-3′ (reverse), ND3 5′-GCGGCTTCGACCCTATATC-3′ (forward), 5′-TGGCAGGTTAGTT GTTTGTAGG-3′ (reverse), ND4 5′-TGAACGCAGGCACATACTTC-3′ (forward), 5′-TCTTGGGCAGT GAGAGTGAG-3′ (reverse), ND5 5′-CATTGTCGCATCCACCTTTA-3′ (forward), 5′-CTGGGTTGTTTGG GTTGTG-3′ (reverse), ND6 5′-GGTGCTGTGGGTGAAAGAGT-3′ (forward), 5′-CTCCCGAATCAA CCCTGAC-3′ (reverse), β-actin 5′-GCCAGTGGACTCCACGAC-3′ (forward), 5′-CAACTACATGGTTTA CATGTTC-3′ (reverse).
OXPHOS and glycolysis assay
The intact cellular oxygen consumption rate (OCR) and extracellular acidification rate (ECAR) of TE-1 cells were measured using a Seahorse XF-96 Extracellular Flux Analyzer (Seahorse Bioscience, North Billerica, MA) as previously described [19]. Results were obtained by performing three independent experiments with eight replicates. After the assay was completed, a BCA Protein Assay Kit was used according to the manufacturer’s instructions to determine the protein concentration to normalize OCR and ECAR.
Statistical analysis
All experiments were performed at least three times and the data obtained were analyzed using SPSS version 16.0 (SPSS, Chicago, U.S.A.). The values are presented as the mean ± S.D. For the evaluation of two groups, Student’s t test was used. P<0.05 was considered to indicate a statistically significant difference.
Results
Effects of CoCl2 on the expression of mitochondrial respiratory chain complex subunits
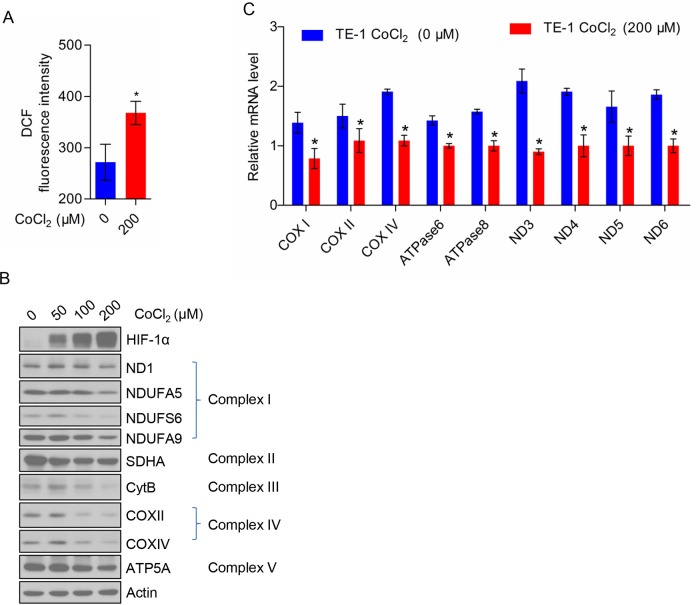
To determine the effect of CoCl2 on TE-1 cells, we first measured the intracellular ROS level in CoCl2-treated TE-1 cells by flow cytometry. CoCl2 treatment significantly increased the ROS production of TE-1 cells as shown in Figure 1A. Next, we treated TE-1 cells with the indicated concentration of CoCl2 (0, 50, 100, and 200 μM) and analyzed the expression of HIF-1α, complex I subunits (ND1, NDUFA5, NDUFS6, and NDUFA9), complex II subunit (SDHA), complex III subunit (Cyt. B), complex IV subunits (COX II and COX IV) and complex V subunit (ATP5A) in TE-1 cells by Western blot. We found that the expression of HIF1-α protein increased in a dose-dependent manner of COCl2. However, the expression of ND1, cytochrome b and COX II encoded by mtDNA and NDUFA5, NDUFS6, NDUFA9, SDHA, COX IV, and ATP5A encoded by nuclear gene were decreased in a dose-dependent manner of CoCl2 treatment (Figure 1B). To clarify whether CoCl2 regulates the protein expression or transcription, we further examined the mRNA levels of these proteins (Figure 1C).
Figure 1. CoCl2 inhibits the expression of mitochondrial respiratory chain complex subunits.
(A) CoCl2 (200 μM) induces ROS production in TE-1 cells. (B) The expression profile of mitochondrial respiratory chain complex subunits and HIF-1α in TE-1 cells treated with a gradient concentration of CoCl2. (C) CoCl2 (200 μM) reduces the mRNA level of mitochondrial respiratory chain complex subunits of TE-1 cells.
Taken together, our findings indicated that CoCl2 may inhibit mitochondrial respiration in TE-1 cells.
Effect of CoCl2 on TE-1 cell bioenergetics metabolism
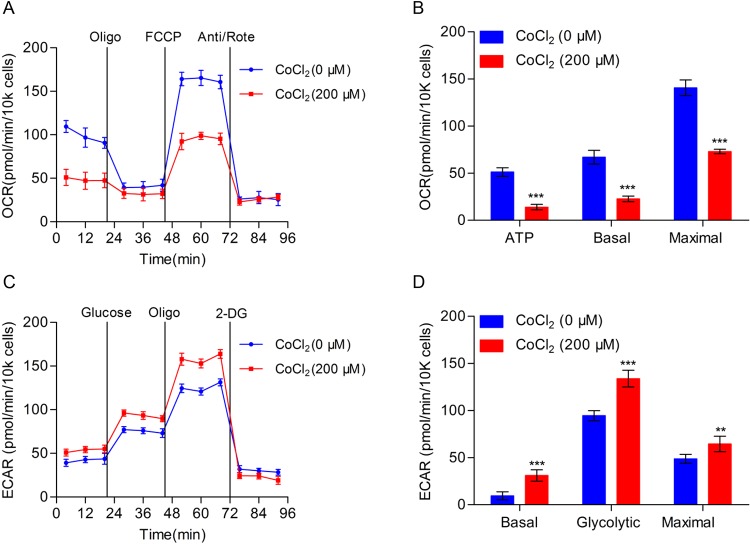
In order to further study the effect of CoCl2 on cellular bioenergetics metabolism, we used Seahorse XF96 Extracellular Flux Analyzers to detect the OCR and found that OCR in TE-1 cells decreased significantly after treating with CoCl2 for 24 h (Figure 2A). The production of ATP, basal respiration, and maximal respiration was markedly reduced and the difference was statistically significant (Figure 2B). In addition, we detected the ability of glycolysis in TE-1 cells when treated with CoCl2, as result showed that when compared with the negative control, the glycolysis ability of TE-1 cells significantly increased under the treatment of CoCl2 and the difference was statistically significant (Figure 2C,D).
Figure 2. The effect of CoCl2 on bioenergetics metabolism in TE-1 cells.
(A) TE-1 cells with or without CoCl2 (200 μM) treatment for 24 h, and the OCR was measured real-time using Seahorse XF96 Extracellular Flux analyzer. The basal OCR was measured at three time points, and then four chemicals were injected into the medium sequentially: the ATP synthase inhibitor oligomycin (1 μM), the uncoupler FCCP (1 μM), the complex I inhibitor rotenone (1 μM), and complex III inhibitor antimycin (1 μM). (B) Statistical analysis of OCR in TE-1 cells with or without CoCl2 (200 μM) treatment. ATP production, basal, and maximal respiration were presented as mean ± S.D. of six replicates. (C) TE-1 cells treated with or without CoCl2 (200 μM) treatment for 24 h. ECAR was detected by the Seahorse XF96 Extracellular Flux Analyzer. Three drugs were added sequentially: glucose (10 mM), oligomycin (1 μM), and 2-DG (100 mM). (D) Statistical analysis of ECAR in TE-1 cell with or without CoCl2 (200 μM) treatment. Basal ECAR, glycolytic ECAR, and maximal ECAR are presented as mean ± S.D. of six replicates; **P<0.01, ***P<0.001.
NAC could rescue the effect of CoCl2 on the expression of mitochondrial respiratory chain complex subunits and bioenergetics metabolism of TE-1 cells
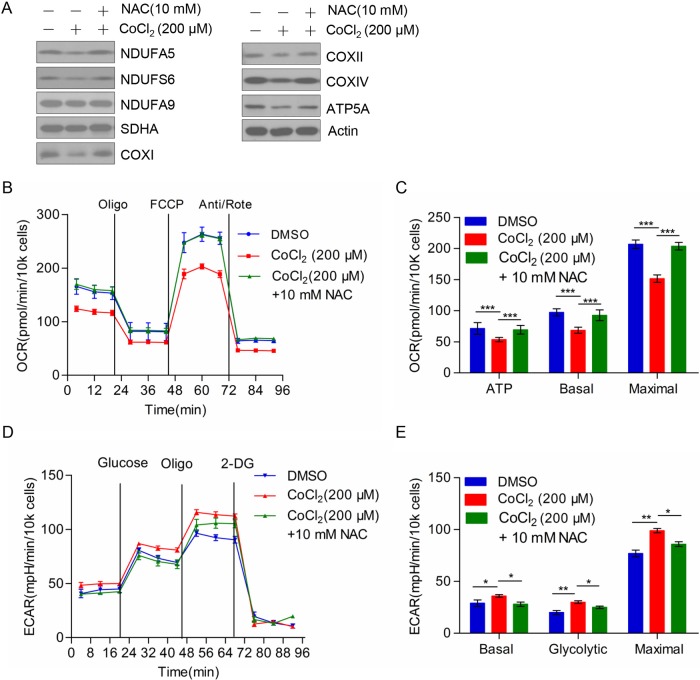
HIF-1α was one of the important transcription factors in tumor development and progression, contributed to cell survival, and activation of gene expression under hypoxic condition. The target genes mainly related to metabolism of carbohydrates that include glycolytic enzymes, aldolase A, and glucose transporter protein-1 (GLUT-1). We hypothesized that ESCC cell TE-1 may switch cellular energy metabolism from mitochondrial OXPHOS to glycolysis under hypoxic conditions stimulated by CoCl2. On the one hand, TE-1 cells inhibited the expression of mitochondrial complex subunits by increasing ROS level; on the other hand, TE-1 cell enhanced glycolysis ability by increasing the expression of glucose metabolism related enzymes. To demonstrate our hypothesis, we set three groups: the negative control group, CoCl2 treated group, and both CoCl2 and N-acetyl cysteine (NAC, ROS scavenger) treated group. Western blot was used to detect mitochondrial complex subunits protein expression in the three groups. We found that the subunits of mitochondrial complex recovered obviously in the group of TE-1 cells treated with CoCl2 and NAC simultaneously (Figure 3A). Meanwhile, by using Seahorse Bioenergetics Analyzer to measure OCR, we found that NAC could significantly rescue mitochondrial respiration in TE-1 cells treated with CoCl2 (Figure 3B). The difference was statistically significant (Figure 3C). Additionally, we found that NAC could rescue CoCl2 induced up-regulation of aerobic glycolysis. As shown in Figure 3D, NAC treatment decreased aerobic glycolysis enhanced by CoCl2. Moreover, we assessed the basal glycolytic rate, spare glycolytic, and maximal glycolytic rate, which indicated that NAC treatment could reverse CoCl2 induced aerobic glycolysis (Figure 3E). Hence these results suggested that ESCC cell TE-1 maintained cell survival by the transformation of energy metabolism under conditions of low oxygen caused by CoCl2.
Figure 3. NAC rescued the effect of CoCl2 on the expression of mitochondrial respiratory chain complex subunits and bioenergetics metabolism in TE-1 cells.
(A) The expression of HIF-1α and mitochondrial complex subunits in control group (DMSO), CoCl2 (200 μM) treated group, CoCl2 (200 μM), and NAC (10 mM) treated group. (B) OCR of control group (DMSO), CoCl2 (200 μM) treated group, CoCl2 (200 μM), and NAC (10 mM) treated group in TE-1 cells. (C) ATP production, basal respiration, and maximal respiration were presented as mean ± S.D. of six replicates. Quantitation and statistical analysis of data from (B). (D) Overall ECAR of TE-1 cells which was treated by CoCl2 in the presence or absence of NAC. (E) Basal glycolytic rate, spare glycolytic, and maximal glycolytic rate were assessed according to the manufacturer’s protocol; *P<0.05, **P<0.01, ***P<0.001.
H2O2 induced TE-1 cells death through generation of ROS
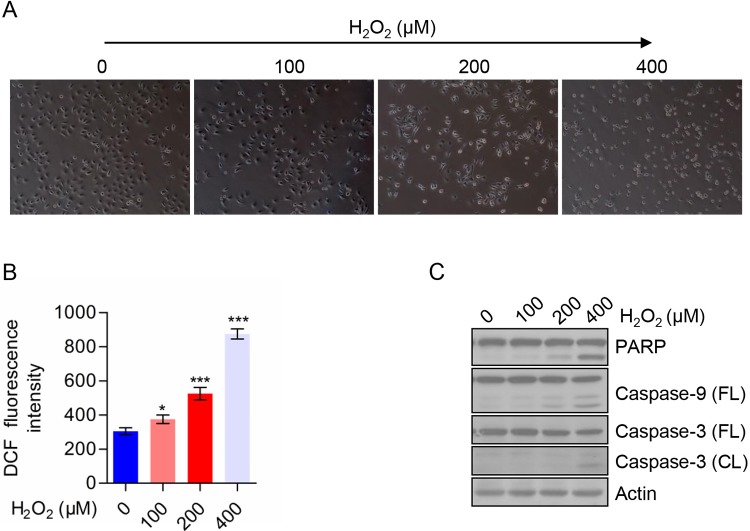
As shown in Figure 4A, we treated TE-1 cells with the indicated concentration of H2O2. We observed cell morphological changes under phase contrast microscopy. With the increase in the concentration of H2O2, the cell viability was decreased compared with the control group as well as the cell size became smaller, indicating that the cells tended to apoptotic state. To explore the effect of H2O2 on TE-1 cells, we analyzed the intracellular ROS level by flow cytometry. The result showed that compared with the negative control group, intracellular ROS level increased in a dose-dependent manner in H2O2-treated TE-1 cells (Figure 4B). In order to further examine the apoptotic rate of cells, we detected the apoptosis-related proteins by Western blot and the results showed that cleaved-PARP, cleaved-Caspase 3, and cleaved-Caspase 9 were increased in a dose-dependent manner with H2O2 treatment from 100 to 400 μM (Figure 4C). These data indicated that H2O2 could induce TE-1 cells death that is mediated through caspase activation. We also analyzed the effects of H2O2 and CoCl2 on cell growth, and found that both H2O2 and CoCl2 could suppress cell growth in TE-1 cells. However, H2O2 had a stronger suppressive activity than CoCl2 on TE-1 cells (Supplementary Figure S1). We further detected the cell death of CoCl2-treated cells, however, the treatment of CoCl2 had no significant effect on cell death of TE-1 cells (Supplementary Figure S2).
Figure 4. H2O2 induced TE-1 cells death through generation of ROS.
(A) Morphology of TE-1 cells treated with the indicated concentrations of H2O2. (B) ROS level of TE-1 cells treated with the indicated concentration of H2O2. (C) The expression of apoptosis-related proteins in TE-1 cells treated with the indicated concentrations of H2O2. All data are presented as mean ± S.D.; *P<0.05, ***P<0.001.
H2O2 reduced the expression of mitochondrial respiratory chain complex subunits and bioenergetics metabolism in TE-1 cells
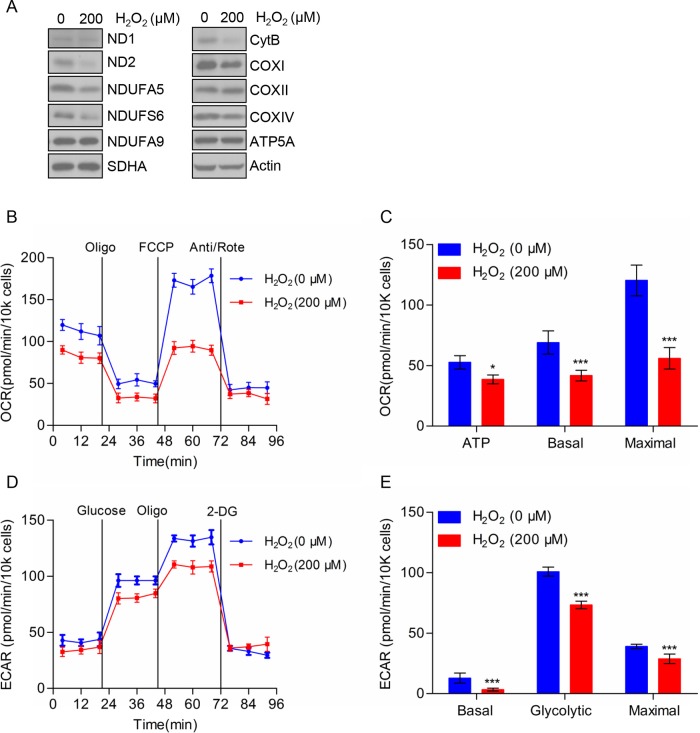
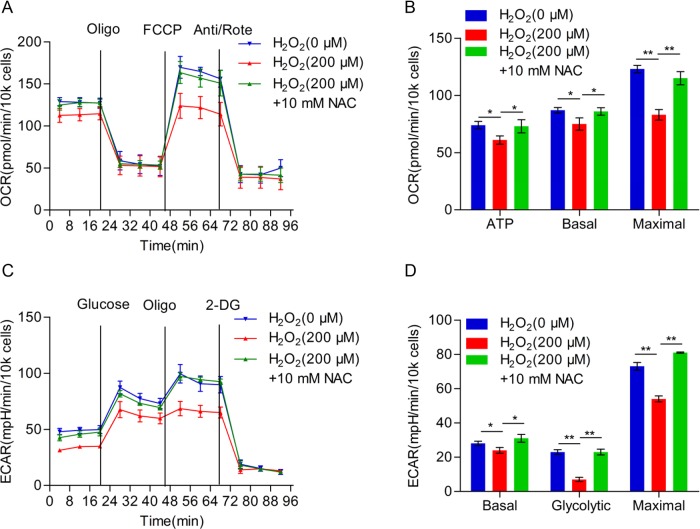
Next, we assessed the protein level in mitochondrial respiratory chain complex subunits in TE-1 cells treated with H2O2 by using Western blot analysis. As shown in Figure 5A, the expression of complex І subunits (ND2, NDUFA5, NDUFS6, and NDUFA9), complex III subunit Cyt. B and complex IV subunits (COXI and COXIV) were decreased in TE-1 cells treated with H2O2. However, there were no significant difference in the protein expression level of complex II subunit SDHA and complex V subunit ATP5A. To further investigate the effects of H2O2 on TE-1 cellular bioenergetics, we analyzed mitochondrial respiration by determining the OCR (Figure 5B), and found that cells under the treatment of H2O2 displayed a lower basal respiration and a significantly lower maximum respiratory capacity and accompanied by less ATP production compared with the negative control group (Figure 5C). In addition, we found that the glycolysis rates of TE-1 cells were significantly decreased after H2O2 treatment (Figure 5D,E). To further confirm the reduction in respiration and aerobic glycolysis were caused by H2O2 treatment, we used ROS scavenger NAC to investigate whether NAC could rescue these effects. As shown in Figure 6A, we found that NAC treatment dramatically reverses H2O2 induced mitochondrial respiration reduction, as well as ATP production, basal respiration, and maximal respiration (Figure 6B). Moreover, we detected the alterations in ECAR, and found that NAC could also rescue aerobic glycolysis suppressed by H2O2 (Figure 6C). In addition, basal glycolytic rate, spare glycolytic rate, and maximal glycolytic rate were assessed (Figure 6D). Consistently, NAC could reverse these three indexes of aerobic glycolysis. These results indicated that H2O2 could cause the reduction in cellular bioenergetics of TE-1 cells via decreasing the expression of mitochondrial respiratory chain complex subunits.
Figure 5. Effects of H2O2 on the expression of mitochondrial respiratory chain complex subunits and bioenergetics metabolism of TE-1 cells.
(A) TE-1 cells were pretreated with or without 200 μM H2O2 for 24 h and the cells were subjected to Western blot analysis. (B) OCR of TE-1 cells treated with H2O2 (200 μM). (C) ATP production, basal, and maximal respiration are presented as mean ± S.D. of six replicates. (D) ECAR of TE-1 cells treated with H2O2 (200 μM). (E) Quantitation of the ECAR performed on TE-1 cells as shown in (B). The data are presented as mean ± S.D.; *P<0.05, ***P<0.001.
Figure 6. NAC rescues H2O2 caused reduction in cellular bioenergetics in TE-1 cells.
(A) Overall OCR curve of TE-1 cells treated with H2O2 (200 μM) or H2O2 (200 μM) combined with NAC (10 mM). (B) ATP production, basal respiration, and maximal respiration alterations of TE-1 cells in (A). (C) Overall ECAR curve of TE-1 cells treated with H2O2 (200 μM) or H2O2 (200 μM) combined with NAC (10 mM). (D) Basal glycolytic rate, spare glycolytic rate, and maximal glycolytic rate were assessed according to the treatment as shown in (C); *P<0.05, **P<0.01.
H2O2 promotes apoptosis which could be blocked by NAC
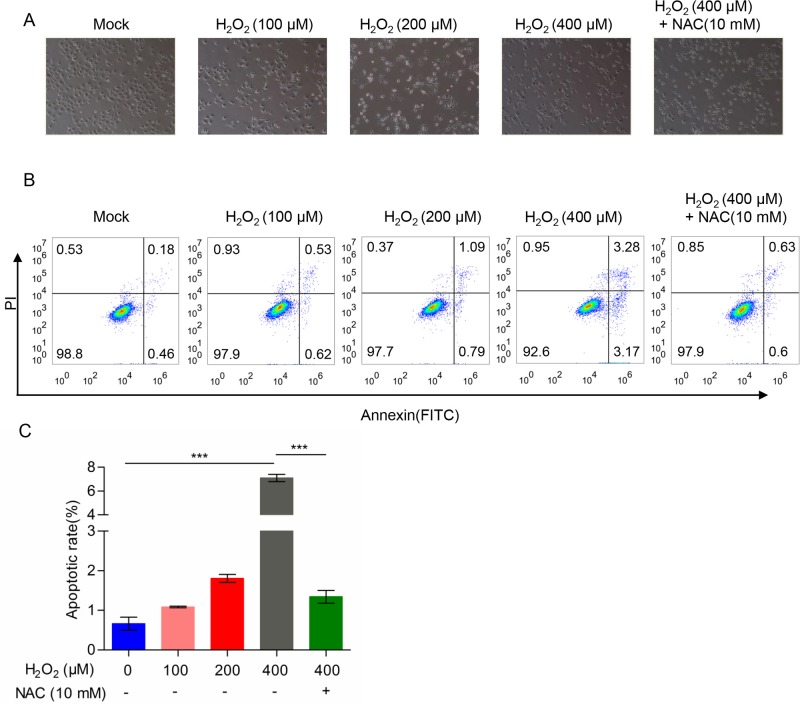
Based on the above data, we speculated that H2O2 induced apoptosis in TE-1 cells may be due to cellular energy metabolism disorders that were caused by the increase in ROS. Therefore, we tested the hypothesis by adding ROS scavenger (NAC) simultaneously, and as shown in Figure 7A, TE-1 cells were treated with H2O2 in the absence or presence of NAC, and we observed that apoptosis reduced obviously in the presence of NAC. Moreover, we examined the apoptosis by flow cytometry, with the increased concentration of H2O2, the apoptosis rate gradually increased, but when TE-1 cells were treated with NAC simultaneously, we found that apoptosis induced by H2O2 was significantly reduced (Figure 7B,C). Thus, we believed that H2O2 may induce the production of ROS and cause progressive oxidative damaged, mitochondrial dysfunction, cell bioenergetics metabolism disorders, and ultimately cell death.
Figure 7. H2O2 induced the apoptosis and NAC could dramatically rescue H2O2-induced apoptosis in TE-1 cells.
(A) Morphology of TE-1 cells treated with H2O2 in the absence or presence of NAC. (B) TE-1 cells were pretreated with a gradient concentration of H2O2 (0, 100, 200, 400 μM) or 400 μM H2O2 and 10 mM NAC. (C) Cell apoptotic rate determined by flow cytometry; ***P<0.001.
Discussion
Accumulating studies have shown that the development of malignant tumors is actually a process of tumor cell metabolism reprogramming [20,21], which is one of the hallmarks of most human tumors [22]. Mitochondria as key actors in cancer metabolic reprogramming, not just because these organelles play a significant role in energy production [23] and biosynthetic intermediates formation, as well as occurrence of mutations in both nuclear and mtDNA encoding metabolic enzymes is associated with different types of cancer [24,25]. Glycolysis is an oxygen-independent metabolic pathway that converts glucose into pyruvate via a series of intermediate metabolites and leads to a net production of ATP [26]. OXPHOS is the metabolic pathway in which cells use enzymes to oxidize nutrients, thereby releasing energy which is accounts for high ATP yield [27]. OXPHOS is a critical part of metabolism, however, it also produces ROS which leads to damaging cells and contributes to diseases and agieng. The Warburg effect suggests that the levels of different cellular energy metabolism are not the same [28]. Cancer cells mainly produce ATP by a high rate of glycolysis followed by lactic acid fermentation in the cytosol, rather than by a relatively low rate of glycolysis followed by oxidation of pyruvate in mitochondria as in most normal cells [29]. Previous studies have shown that mutations in mtDNA, mitochondrial fusion and fission dysfunction and mitochondria-related active enzyme mutation can cause normal cells transformed into cancer cells [30,31]. The enzymes involved in glycolysis are also the target of many anticancer drugs that inhibit their activities or regulate gene expression [32].
It is well known that ROS produced by aerobic cells during metabolic processes and have important roles in cell signaling and homeostasis [33,34]. However, while undergoing a wide variety of environmental stress, ROS levels can increase dramatically thus leading to oxidative damage to cells [35]. Some studies indicate that ROS levels significantly increased in tumor cells and plays a vital role in the occurrence and development of tumors and also participates in many signaling pathways, such as mitochondrial mediated caspase-dependent apoptotic pathway [36] and regulation of Akt/MAPK-related signaling pathways [37], and even affect the proliferation and differentiation of tumor cells [38–40].
Due to mitochondria being the major sources of ATP or ROS, more and more attention has been focussed on the study of the relationship between energy metabolism and tumor [41–43]. Our present study investigated the mechanism of oxidative stress on the biological energy metabolism of ESCC cells. We used the oxidative stress inducer CoCl2 and H2O2 to treat TE-1 cells to study the effects of different stress on cellular bioenergy metabolism.
First of all, we utilized CoCl2 to simulate hypoxic microenvironments. Under hypoxic conditions, HIF-1α is no longer degraded and translocated to the nucleus regulating hundreds of genes, and many of them play important roles in cancer cell metabolism [44]. Our findings demonstrate that CoCl2 induced the production of ROS and reduced the expression of mitochondria respiratory chain enzyme complex subunits due to reduced gene transcription and protein synthesis. To further confirm the effects of CoCl2 on the energy metabolism of TE-1 cells, we detected the OCR and ECAR to evaluate the ability of TE-1 cells OXPHOS and glycolysis, our results indicate that the mitochondrial respiration was significantly decreased, accompanied by the increase in glycolysis rates. This is consistent with the findings in breast cancer [27]. Additionally, we used the ROS scavenger (NAC) to verify our previous hypothesis, and NAC could dramatically rescue from the effects induced by CoCl2, which suggest that tumor cell may undergo the metabolic reprogramming to survive under adverse conditions.
Second, H2O2 as a widely used inducer of cell damage and apoptosis, is capable of producing large amounts of oxygen free radicals that cause cellular oxidative stress [45,46]. Our data proved that H2O2 indeed could induce apoptosis and inhibit the expression of mitochondria respiratory chain complex subunits. Moreover, we found that H2O2 could dramatically suppress the OCR and ATP production and simultaneously inhibited the cellular glycolytic rate. Hence, we proposed that the apoptosis induced by H2O2 may be due to the energy metabolism dysfunction that is caused by the increase in ROS levels. This was further confirmed that NAC pretreatment significantly abolished H2O2-induced apoptosis in TE-1 cells. These results demonstrate that oxidative stress caused by H2O2 leads to severe impairment in TE-1 cell energy metabolism. Moreover, our findings show that H2O2 mediates apoptosis of TE-1 cells through activating caspase 3 and caspase 9. Therefore, H2O2 induced the increase in ROS levels, causing cell oxidative damage, mitochondrial dysfunction, and resulting in cell biological energy metabolism disorder, and ultimately induced apoptosis.
In summary, we found that ESCC TE-1 cells exhibit distinct changes in bioenergy metabolism in response to different oxidative stress. Under hypoxic condition, TE-1 cells are able to switch their metabolic phenotype from OXPHOS to glycolysis as an alternative source of biogenetic substrates to maintain cell survival. However, TE-1 cells are unable to reprogram metabolism when they are exposed to H2O2, and eventually leads to cell death due to energy deficiency. This may provide as a novel strategy for treatment of ESCC, and which is also helpful to solve the problems of drug resistance of ESCC by combination with current treatment and realize the specific targetted therapy of tumor cells.
Supporting information
Supplemental Figure 1.
Effects of H2O2 and CoCl2 on TE-1 cell growth.
(A) TE-1 cells were treated with a gradient concentration of CoCl2 (0, 50, 100, 200 μM) for 0, 24, 48, 72 h. (B) TE-1 cells were treated with various dose of H2O2 (0, 100, 200, 400 μM) for 0, 24, 48, 72 h. Cell number was counted by flow cytometry.
Supplemental Figure 2.
TE-1 cells were pre-treated with a gradient concentration of CoCl2 (0, 50, 100, 200 μM) or 200 μM CoCl2 and NAC (5, 10 mM) for 24h, and the apoptotic cell rate was determined by using Annexin V FITC/PI cell apoptosis detect kit on the BD Accuri™ C6 Plus System.
Acknowledgments
We thank Dr Charles Reichman and members of the Lu lab for their suggestions on this manuscript.
Abbreviations
- Cyt. b
Cytochrome b
- DCF
Dichlorofluorescein
- DCFH-DA
Dichlorodihydrofluorescein diacetate
- 2-DG
2-Deoxy-D-glucose
- ECAR
extracellular acidification rate
- EGFR
epidermal growth factor receptor
- ERK
extracellular regulated protein kinases
- ESCC
esophageal squamous cell carcinoma
- FCCP
carbonylcyanide-p-trifluoromethoxyphenylhydrazone
- HIF-1α
hypoxia-inducible factor-1α
- HRP
horseradish peroxidase
- JNK
c-Jun N-terminal kinase
- MAPK
mitogen-activated protein kinase
- NAC
N-acetyl cysteine
- OCR
oxygen consumption rate
- OXPHOS
oxidative phosphorylation
- PARP
poly ADP-ribose polymerase
- PI
oropidium iodine
- PTK
protein tyrosine kinase
- qRT-PCR
quantitative real-time PCR
- ROS
reactive oxygen species
- RPMI--1640
roswell Park Memorial Institute-1640
- SOD
superoxide dismutase
- TBS-T
TBS-Tween
Competing interests
The authors declare that there are no competing interests associated with the manuscript.
Author contribution
B.L. and L.L. conceived the idea, supervised the research, and wrote the manuscript. X.Z., L.L., L.N., J.L., C.L., M.G., S.M., and J.L. performed the experiments. Y.L., L.L., and B.L. performed data analyses. All the authors read and approved the final manuscript.
Funding
This work was supported by the National Natural Science Foundation of China [grant numbers 31570772, 31070710, 31171345 (to B.L.)]; the Natural Science Foundation of Zhejiang Province [grant number LY17C070005 (to Y.L.)]; and the Wenzhou Municipal Science and Technology Bureau [grant number Y20140670 (to X.Z.)].
References
- 1.Jemal A., Bray F., Center M.M., Ferlay J., Ward E. and Forman D. (2011) Global cancer statistics. CA Cancer J. Clin. 61, 69–90 [DOI] [PubMed] [Google Scholar]
- 2.Ferlay J., Shin H.R., Bray F., Forman D., Mathers C. and Parkin D.M. (2010) Estimates of worldwide burden of cancer in 2008: GLOBOCAN 2008. Int. J. Cancer 127, 2893–2917 [DOI] [PubMed] [Google Scholar]
- 3.Warburg O. (1956) On respiratory impairment in cancer cells. Science 124, 269–270 [PubMed] [Google Scholar]
- 4.Stine Z.E. and Dang C.V. (2013) Stress eating and tuning out: cancer cells re-wire metabolism to counter stress. Crit. Rev. Biochem. Mol. Biol. 48, 609–619 [DOI] [PMC free article] [PubMed] [Google Scholar]
- 5.Talks K.L., Turley H., Gatter K.C., Maxwell P.H., Pugh C.W., Ratcliffe P.J. et al. (2000) The expression and distribution of the hypoxia-inducible factors HIF-1alpha and HIF-2alpha in normal human tissues, cancers, and tumor-associated macrophages. Am. J. Pathol. 157, 411–421 [DOI] [PMC free article] [PubMed] [Google Scholar]
- 6.Semenza G.L. (2003) Targeting HIF-1 for cancer therapy. Nat. Rev. Cancer 3, 721–732 [DOI] [PubMed] [Google Scholar]
- 7.Sumiyoshi Y., Kakeji Y., Egashira A., Mizokami K., Orita H. and Maehara Y, Overexpression of hypoxia-inducible factor-1α and p53 is a marker for an unfavorable prognosis in gastric cancer. Clin. Cancer Res. 12, 5112–5117 [DOI] [PubMed] [Google Scholar]
- 8.Polytarchou C., Hatziapostolou M. and Papadimitriou E. (2005) Hydrogen peroxide stimulates proliferation and migration of human prostate cancer cells through activation of activator protein-1 and up-regulation of the heparin affin regulatory peptide gene. J. Biol. Chem. 28, 40428–40435 [DOI] [PubMed] [Google Scholar]
- 9.López-Lázaro M. (2007) Dual role of hydrogen peroxide in cancer: possible relevance to cancer chemoprevention and therapy. Cancer Lett. 252, 1–8 [DOI] [PubMed] [Google Scholar]
- 10.Wang J. and Yi J. (2008) Cancer cell killing via ROS: to increase or decrease, that is the question. Cancer Biol. Ther. 7, 1875–1884 [DOI] [PubMed] [Google Scholar]
- 11.Rhee S.G. (2006) Cell signaling. H2O2, a necessary evil for cell signaling. Science 312, 1882–1883 [DOI] [PubMed] [Google Scholar]
- 12.Groeger G., Quiney C. and Cotter T.G. (2009) Hydrogen peroxide as a cell-survival signaling molecule. Antioxid. Redox Signal. 11, 2655–2671 [DOI] [PubMed] [Google Scholar]
- 13.Song J., Li J., Qiao J., Jain S., Mark Evers B. and Chung D.H. (2009) PKD prevents H2O2-induced apoptosis via NF-kappa B and p38 MAPK in RIE-1 cells. Biochem. Biophys. Res. Commun. 378, 610–614 [DOI] [PMC free article] [PubMed] [Google Scholar]
- 14.Polytarchou C., Hatziapostolou M. and Papadimitriou E. (2005) Hydrogen peroxide stimulates proliferation and migration of human prostate cancer cells through activation of activator protein-1 and up-regulation of the heparin affin regulatory peptide gene. J. Biol. Chem. 280, 40428–40435 [DOI] [PubMed] [Google Scholar]
- 15.Schieber M. and Chandel N.S. (2014) ROS function in redox signaling and oxidative stress. Curr. Biol. 24, R453–R462 [DOI] [PMC free article] [PubMed] [Google Scholar]
- 16.Veal E.A., Day A.M. and Morgan B.A. (2007) Hydrogen peroxide sensing and signaling. Mol. Cell 26, 1–14 [DOI] [PubMed] [Google Scholar]
- 17.Florea A.M. and Büsselberg D. (2011) Cisplatin as an anti-tumor drug: cellular mechanisms of activity, drug resistance and induced side effects. Cancers (Basel) 3, 1351–1371 [DOI] [PMC free article] [PubMed] [Google Scholar]
- 18.Wagner B.A., Evig C.B., Reszka K.J., Buettner G.R. and Burns C.P. (2005) Doxorubicin increases intracellular hydrogen peroxide in PC3 prostate cancer cells. Arch. Biochem. Biophys. 440, 181–190 [DOI] [PMC free article] [PubMed] [Google Scholar]
- 19.Liu Y., Lan L., Huang K., Wang R., Xu C., Shi Y. et al. (2014) Inhibition of Lon blocks cell proliferation, enhances chemosensitivity by promoting apoptosis and decreases cellular bioenergetics of bladder cancer: potential roles of Lon as a prognostic marker and therapeutic target in baldder cancer. Oncotarget 5, 11209–11224 [DOI] [PMC free article] [PubMed] [Google Scholar]
- 20.Shen Y.A., Wang C.Y., Hsieh Y.T., Chen Y.J. and Wei Y.H. (2015) Metabolic reprogramming orchestrates cancer stem cell properties in nasopharyngeal carcinoma. Cell Cycle 14, 86–98 [DOI] [PMC free article] [PubMed] [Google Scholar]
- 21.Tarrado-Castellarnau M., de Atauri P. and Cascante M. (2016) Oncogenic regulation of tumor metabolic reprogramming. Oncotarget 7, 62726–62753 [DOI] [PMC free article] [PubMed] [Google Scholar]
- 22.Hanahan D. and Weinberg R.A. (2011) Hallmarks of cancer: the next generation. Cell 144, 646–674 [DOI] [PubMed] [Google Scholar]
- 23.Moghadam A.A., Ebrahimie E., Taghavi S.M., Niazi A., Babgohari M.Z., Deihimi T. et al. (2013) How the nucleus and mitochondria communicate in energy production during stress: nuclear MtATP6, an early-stress responsive gene, regulates the mitochondrial FF-ATP synthase complex. Mol. Biotechnol. 54, 756–769 [DOI] [PubMed] [Google Scholar]
- 24.Porporato P.E., Payen V.L., Baselet B. and Sonveaux P. (2016) Metabolic changes associated with tumor metastasis, part 2: Mitochondria, lipid and amino acid metabolism. Cell. Mol. Life Sci. 73, 1349–1363 [DOI] [PMC free article] [PubMed] [Google Scholar]
- 25.Stefano G.B. and Kream R.M. (2015) Cancer: mitochondrial origins. Med. Sci. Monit. 21, 3736–3739 [DOI] [PMC free article] [PubMed] [Google Scholar]
- 26.DeBerardinis R.J., Sayed N., Ditsworth D. and Thompson C.B. (2008) Brick by brick: metabolism and tumor cell growth. Curr. Opin. Genet. Dev. 18, 54–61 [DOI] [PMC free article] [PubMed] [Google Scholar]
- 27.Cairns R.A., Harris I.S. and Mak T.W. (2011) Regulation of cancer cell metabolism. Nat. Rev. Cancer 11, 85–95 [DOI] [PubMed] [Google Scholar]
- 28.Liberti M.V. and Locasale J.W. (2016) The Warburg effect: how does it benefit cancer cells ? Trends Biochem. Sci. 41, 211–218 [DOI] [PMC free article] [PubMed] [Google Scholar]
- 29.Visvader J.E. (2011) Cells of origin in cancer. Nature 469, 314–322 [DOI] [PubMed] [Google Scholar]
- 30.Dupuy F., Tabariès S., Andrzejewski S, Dong Z., Blagih J. and Annis M.G. (2015) PDK1-dependent metabolic reprogramming dictates metastatic potential in breast cancer. Cell Metab. 22, 577–589 [DOI] [PubMed] [Google Scholar]
- 31.Cui X.G., Han Z.T., He S.H., Wu X.D., Chen T.R., Shao C.H. et al. (2017) HIF1/2α mediates hypoxia-induced LDHA expression in human pancreatic cancer cells. Oncotarget 8, 24840–24852 [DOI] [PMC free article] [PubMed] [Google Scholar]
- 32.Pereira W.O. and Amarante-Mendes G.P. (2011) Apoptosis: a programme of cell death or cell disposal? Scand. J. Immunol. 73, 401–407 [DOI] [PubMed] [Google Scholar]
- 33.Wu X., Deng G., Li M., Li Y., Ma C. and Wang Y. (2015) Wnt/β-Catenin signaling reduces Bacillus Calmette-Guerin-induced macrophage necrosis through a ROS -mediated PARP/AIF- dependent pathway. BMC Immunol. 16, 16. [DOI] [PMC free article] [PubMed] [Google Scholar]
- 34.Schieber M. and Chandel N.S. (2014) ROS function in redox signaling and oxidative stress. Curr. Biol. 24, R453–R462 [DOI] [PMC free article] [PubMed] [Google Scholar]
- 35.Cheresh P., Kim S.J., Tulasiram S. and Kamp D.W. (2013) Oxidative stress and pulmonary fibrosis. Biochim. Biophys. Acta 1832, 1028–1040 [DOI] [PMC free article] [PubMed] [Google Scholar]
- 36.Sampson V.B., Vetter N.S., Kamara D.F., Collier A.B., Gresh R.C. and Kolb E.A. (2015) Vorinostat enhances cytotoxicity of SN-38 and temozolomide in ewing sarcoma cells and activates STAT3/AKT/MAPK pathways. PLoS ONE 10, e0142704. [DOI] [PMC free article] [PubMed] [Google Scholar]
- 37.Schumacker P.T. (2006) Reactive oxygen species in cancer cells: live by the sword, die by the sword. Cancer Cell 10, 175–178 [DOI] [PubMed] [Google Scholar]
- 38.Hamanaka R.B. and Chandel N.S. (2010) Mitochondrial reactive oxygen species regulate cellular signaling and dictate biological outcomes. Trends Biochem. Sci. 35, 505–513 [DOI] [PMC free article] [PubMed] [Google Scholar]
- 39.Gupta S.C., Hevia D., Patchva S., Park B., Koh W. and Aggarwal B.B. (2012) Upsides and downsides of reactive oxygen species for cancer: the roles of reactive oxygen species in tumorigenesis, prevention, and therapy. Antioxid. Redox Signal. 16, 1295–1322 [DOI] [PMC free article] [PubMed] [Google Scholar]
- 40.Valko M., Rhodes C.J., Moncol J., Izakovic M. and Mazur M. (2006) Free radicals, metals and antioxidants in oxidative stress-induced cancer. Chem. Biol. Interact. 160, 1–40 [DOI] [PubMed] [Google Scholar]
- 41.Iommarini L., Ghelli A., Gasparre G. and Porcelli A.M. (2017) Mitochondrial metabolism and energy sensing in tumor progression. Biochim. Biophys. Acta 1858, 582–590 [DOI] [PubMed] [Google Scholar]
- 42.Troncone M, Cargnelli SM, Villani LA, Isfahanian N., Broadfield L.A. and Zychla L. (2017) Targeting metabolism and AMP-activated kinase with metformin to sensitize non-small cell lung cancer (NSCLC) to cytotoxic therapy; translational biology and rationale for current clinical trials. Oncotarget 10.18632/oncotarget.17496 [DOI] [PMC free article] [PubMed] [Google Scholar]
- 43.Strickland M. and Stoll E.A. (2017) Metabolic reprogramming in glioma. Front. Cell Dev. Biol. 5, 43. [DOI] [PMC free article] [PubMed] [Google Scholar]
- 44.Masoud G.N. and Li W. (2015) HIF-1α pathway: role, regulation and intervention for cancer therapy. Acta Pharm. Sin. B 5, 378–389 [DOI] [PMC free article] [PubMed] [Google Scholar]
- 45.Nogueira V., Park Y., Chen C.C., Xu P.Z., Chen M.L., Tonic I. et al. (2008) Akt determines replicative senescence and oxidative or oncogenic premature senescence and sensitizes cells to oxidative apoptosis. Cancer Cell 14, 458–470 [DOI] [PMC free article] [PubMed] [Google Scholar]
- 46.Liu J., Chung H.J., Vogt M., Jin Y., Malide D., He L. et al. (2011) JTV1 co-activates FBP to induce USP29 transcription and stabilize p53 in response to oxidative stress. EMBO J. 30, 846–858 [DOI] [PMC free article] [PubMed] [Google Scholar]


