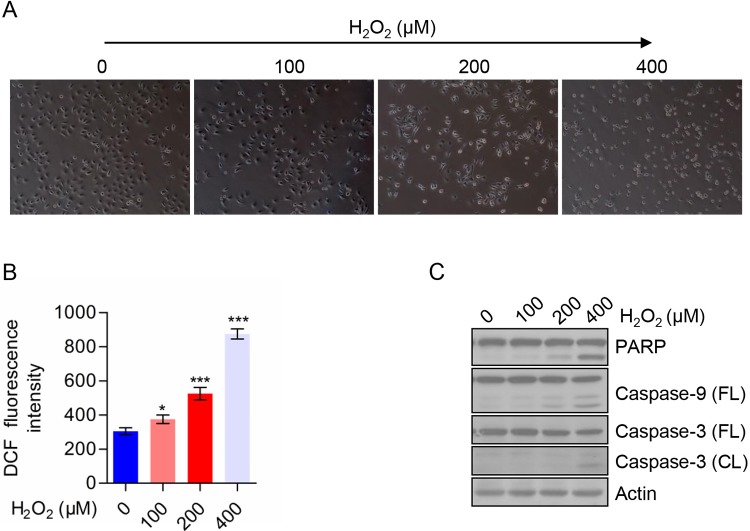
Figure 4. H2O2 induced TE-1 cells death through generation of ROS.
(A) Morphology of TE-1 cells treated with the indicated concentrations of H2O2. (B) ROS level of TE-1 cells treated with the indicated concentration of H2O2. (C) The expression of apoptosis-related proteins in TE-1 cells treated with the indicated concentrations of H2O2. All data are presented as mean ± S.D.; *P<0.05, ***P<0.001.

