
Fig. 5.
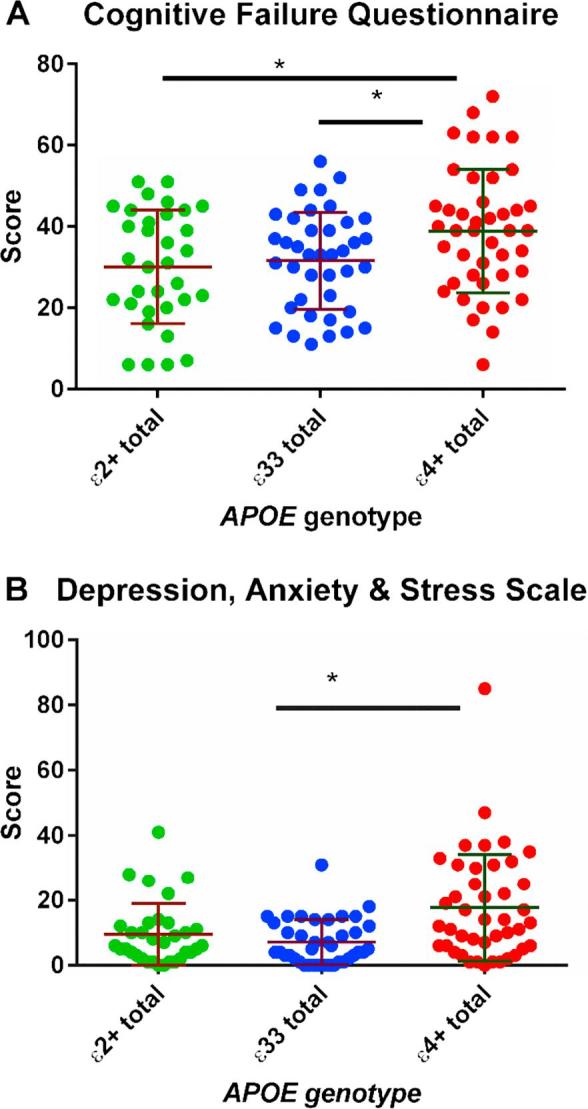
Results from the CFQ (A). Standard deviations for each group are shown in the error bars. There was evidence from a post-hoc Dunn’s test that the ε4+ group had higher scores than the ε33 (p = 0.021) group and the ε2+ group (p = 0.015). As shown in figure B the ε4+ group had higher scores on the DASS. * denotes p < 0.05.