
Figure 6.
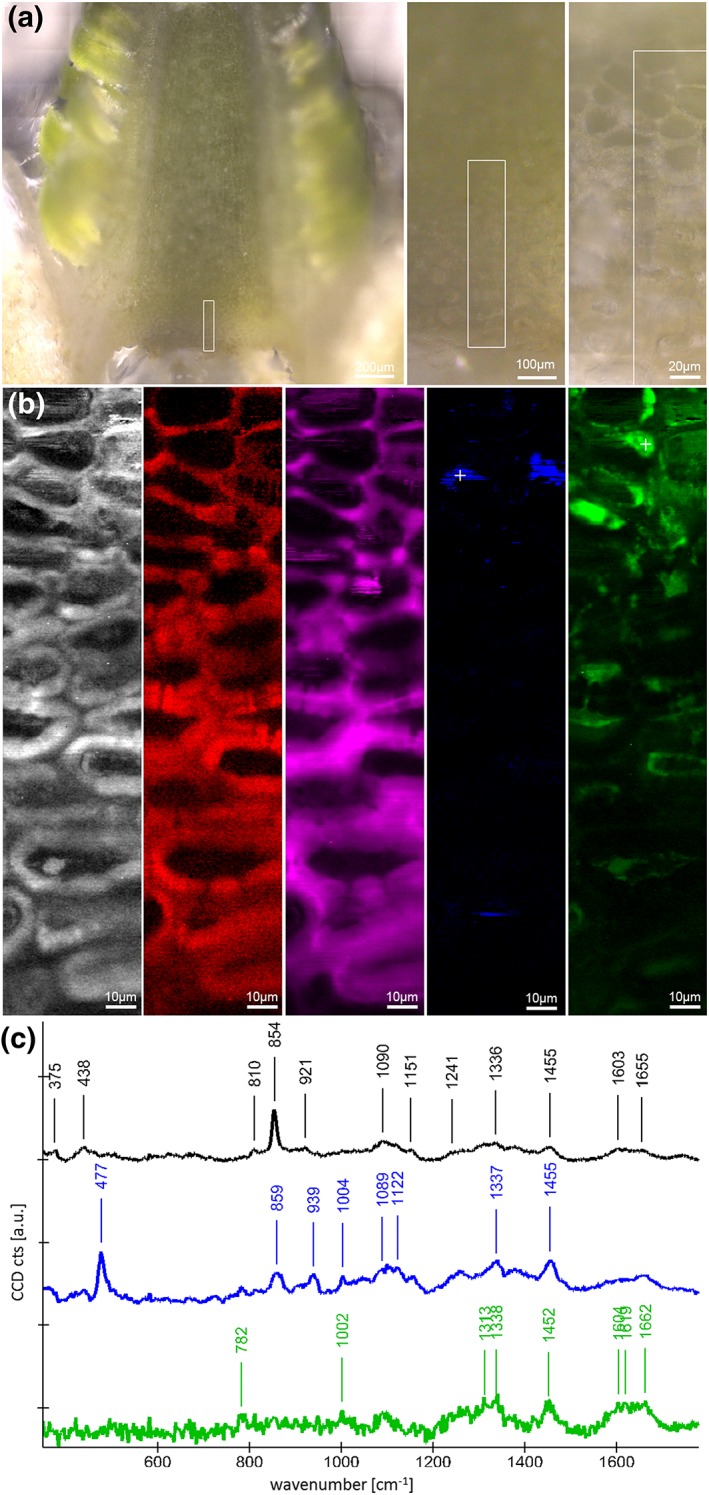
Raman imaging on a microcut winter bud of Picea abies: (a) The region of interest was restricted to the crown tissue as marked in the light microscopic overview images. After spectra acquisition, Raman images (b) were calculated by integrating from 1,056 to 1,137 cm−1 (black and white, all structures), 370 to 385 cm−1 (red, cellulose), 838 to 868 cm−1 (pink, pectin), 462 to 500 cm−1 (blue, starch), and 1,523 to 1,700 cm−1 (green, protein). (c) Extracted Raman spectra reveal details on the molecular structure of the whole investigated region (black spectrum) and the starch (blue spectrum) and protein (green spectrum) rich deposits. White crosses in the Raman images mark the position of the extracted starch and protein spectrum. CCD = charge‐coupled device