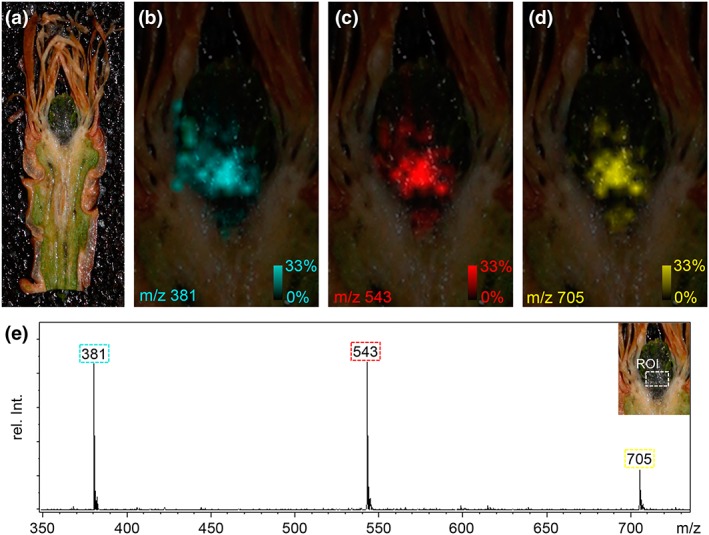
Figure 7.

Matrix‐assisted laser desorption/ionization time‐of‐flight mass spectrometry imaging (MALDI‐TOF MSI) of a longitudinal section of a vegetative winter bud of Picea abies. (a) The bud section (approx. 20‐μm thick) was fixed on the MALDI target using a conductive double‐sided adhesive tape, covered with 2,5‐dihydroxybenzoic acid matrix and rastered (laser spot size was set to 35 μm) at a lateral resolution of 100 μm. In the positive‐ion mode three prominent signals were observed at m/z 381, m/z 543 and m/z 705 in the lower region of the primordium. The corresponding ion images (in false colors cyan, red and yellow; relative signal intensities were in the range from 0 to 33%) are depicted in Panels b–d. (c) Average MALDI‐TOF mass spectrum in the range of m/z 350 to m/z 750 found in the defined region of interest (ROI as shown in the insert of Panel D). The signals were identified as potassiated quasimolecular ions ([M + K]+) of a disaccharide ([C12H22O11 + K]+; calc. m/z 381.0794), a trisaccharide ([C18H32O16 + K]+; calc. m/z 543.1322) and a tetrasaccharide ([C24H42O21 + K]+; calc. m/z 705.1850)
