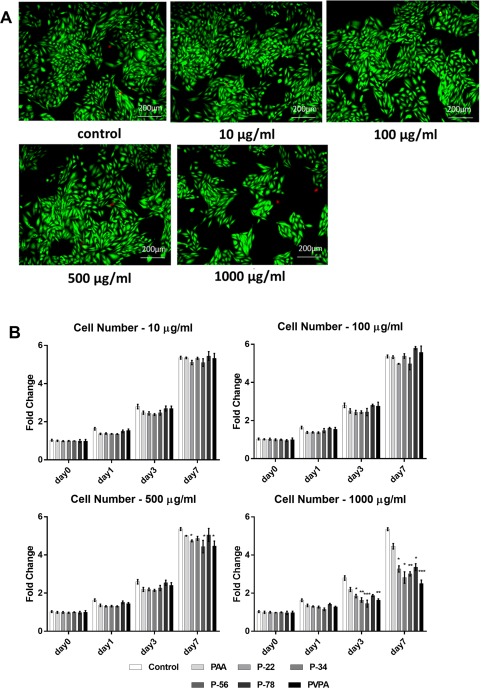
Figure 2.

SaOS‐2 cell viability and cell number subject to different PVPA‐co‐AA polymer treatments at different concentrations (A) Representative SaOS‐2 cells subject to a range of PVPA‐co‐AA polymer treatments at different concentrations stained with fluorescent Live/Dead Double Staining at day 7 day; live cells appear green, dead cells appear red. (B) SaOS‐2 cell number subject to PVPA‐co‐AA polymer treatments at different concentrations measured by AlamarBlue® Cell Viability assay at day 0, 1, 3, 7. The graph shows means ± SD of data. Asterisks indicate significant (*p < 0.05, **p < 0.01, ***p < 0.001) difference in fold change vs. the control at the same time point.
