Figure 6.

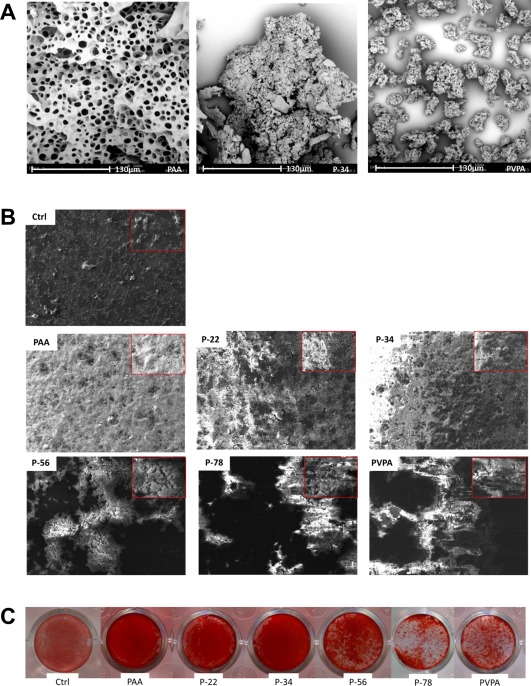
Representative SEM images (A and B) and a comparison with Alizarin red mineralization staining (C). SEM images demonstrate the differences in the polymer‐calcium complexes, indicative of the chelation capacities of the different polymer ratios, whereby the increasing amount of VPA (0, 34, and 100 mol % VPA) show increased levels of granulation/particle formation when exposed to the same concentrations of Ca2+ ions (A). The subsequent effects of the different AA:VPA ratio on the culture of SaOS‐2 cells, is demonstrated with a lower magnification image is inset (B); the differences in particle formation of morphology of particles was considered to play a role in the mineralization behavior in association with cells. Dark areas are indicative of acellular regions on the surface of the thermanox coverslip and appear featureless in contrast with the bright areas of mineralized material. In comparison to the SEM the calcium deposition observed by SEM could be correlated to the mineralization observed by alizarin red staining for calcium (C), where increasing the mol % VPA resulted in more agglomerated clusters of mineralization, whereas P‐34 demonstrated a much more homogenous layer of mineralization with the presence of nodulelike formations.
