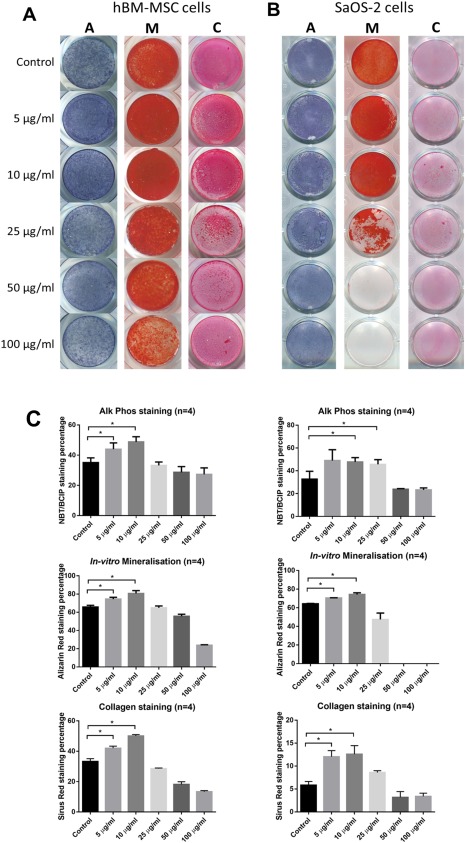
Figure 7.

Osteogenic effect of PVPA‐co‐AA polymer in SaOS‐2 cells and human BM‐MSCs. Representative photos showing the patterns and quantified percentage of ALP, in‐vitro mineralization, and collagen staining of (A) human BM‐MSCs and (B) SaOS‐2 cells subject to P‐34 polymer treatments at different concentrations. The graph shows means ± SD of data. Asterisks indicate significant (*p < 0.05, **p < 0.01, ***p < 0.001) increase in the staining percentage vs. the control at the same time point.
