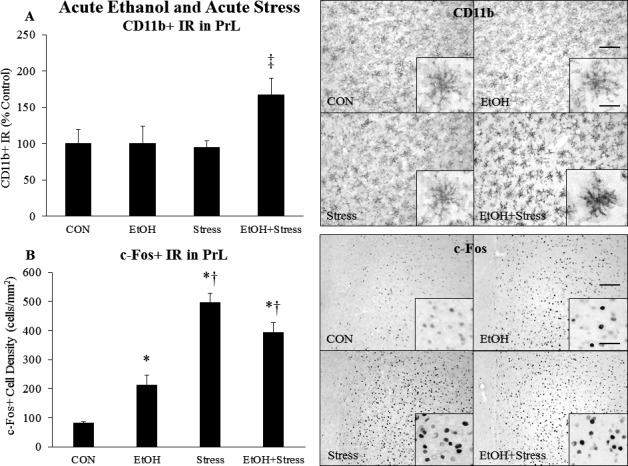
Figure 3.

Effects of acute ethanol (EtOH) and acute stress on CD11b+ IR and c‐Fos+ IR in the prelimbic cortex. Rats were treated with EtOH (5.0 g/kg, 25% v/v, i.g.) and/or a 2‐hour restraint/water immersion stressor and sacrificed immediately following the conclusion of the stressor. (A) CD11b+ pixel density in the PrL was assessed in each group. Data are presented as mean ± SEM. ‡ p < 0.05 compared to Stress (Tukey's post hoc test). n = 4 to 10/group. A representative image of CD11b staining from each group is shown. A higher magnification image is displayed in the inset. The scale bar in the low‐magnification image measures 100 microns, and the scale bar in the high‐magnification inset measures 20 microns. (B) c‐Fos+ cell density in the PrL was assessed in each group. Data are presented as mean ± SEM. *p < 0.05 compared to CON, † p < 0.05 compared to EtOH (Tukey's post hoc test). n = 4 to 10/group. A representative image of c‐Fos staining from each group is shown. A higher magnification image is displayed in the inset. The scale bar in the low‐magnification image measures 100 microns, and the scale bar in the high‐magnification inset measures 20 microns.
