Figure 2.

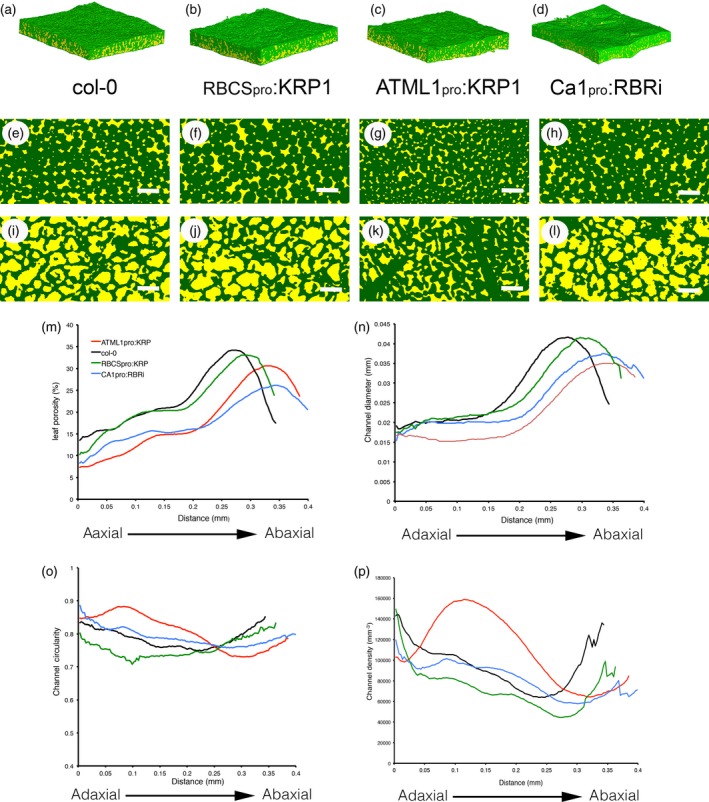
MicroCT imaging reveals variation in leaf airspace patterns. (a–d) 3D rendering of tissue blocks from (a) Col‐0, (b) RBCS pro:KRP1, (c) ATML1pro:KRP1 and (d) CA1pro:RBRi leaf samples. (e–l) Paradermal sections through the tissue blocks shown in a–d at a position towards the adaxial palisade surface (E–H) or towards the abaxial spongy surface (i–l). In (a–l), solid tissue has been painted green, and airspace has been painted yellow. (m) porosity values, (n) air channel diameter, (o) air channel circularity and (p) air channel density at distances below the adaxial surface of samples from wild‐type (WT, black), RBCS pro:KRP1 (green), ATML1pro:KRP1 (red) and CA1pro:RBRi (blue) leaves. For clarity, only mean values are indicated. Resolution in (e–l): 2.75 μm. Scale bars: 0.5 mm.
