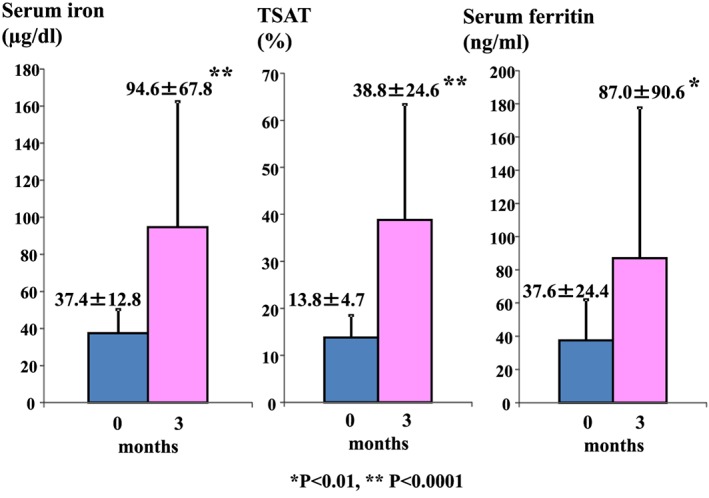
Figure 1.

Subjects’ transferrin saturation (TSAT) values and serum iron and ferritin levels at the baseline and after 3 months’ sodium ferrous citrate treatment. Data are expressed as mean ± standard deviation values. *P < 0.01, ** P < 0.0001 compared with the baseline values.
