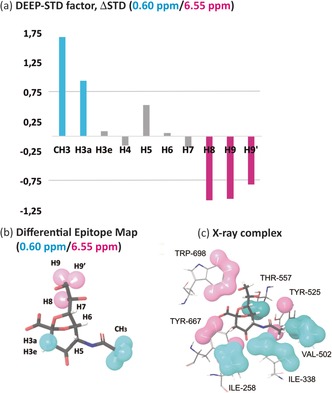
Figure 2.

Differential Epitope Mapping (0.6/6.55 ppm) of 2,7‐anhydro‐Neu5Ac in complex with RgNanH‐GH33. a) ΔSTD histogram: positive ΔSTDs (above the limit of +0.75) after aliphatic irradiation (0.6 ppm) are shown in cyan, and negative ΔSTDs (below −0.75) after aromatic irradiation (6.55 ppm) in magenta. b) DEEP‐STD map of the ligand. Cyan surfaces highlight ligand contacts with aliphatic side chains; magenta surfaces show contacts with aromatic side chains. c) Crystal structure of the complex (PDB ID: 4X4A).9 Protons were added using Schrodinger software.14 Protein protons are colored as a function of their NMR frequencies: those directly irradiated at 0.6 ppm (aliphatic residues) in cyan and those directly irradiated at 6.55 ppm (aromatic residues) in magenta (Table S1). Comparison of (b) and (c) highlights the excellent match of the differential epitope map of the ligand with the distribution of aliphatic and aromatic residues in the binding pocket.
