
Figure 3.
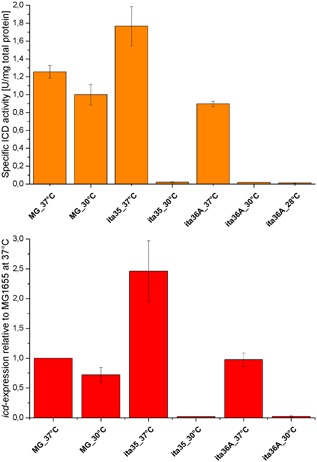
Top: Specific activities of the isocitrate dehydrogenase (ICD). The activity was normalized to the total protein content in the sample. Bottom: Relative expression of icd normalized to the wild type at 37°C. Error bars represents the standard deviation of two independent biological samples (for the activity) and three independent biological samples (for the expression level). The expression level of ita36A at 28°C was not determined