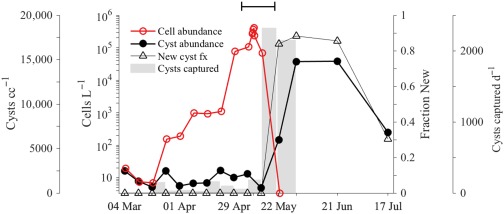
Figure 4.

Measures of bloom progression and new cyst deposition made through weekly water and sediment sampling. Cell concentrations (red) are means of bottle samples collected at 1 m, 3 m, 5 m, and 7 m. Cyst abundance and new cyst fractions (closed black circles and open black triangles, respectively) are means of triplicate sampling of surficial sediment (0–1 cm layer) near the northern shore of Salt Pond. Cyst capture rate by tube traps deployed at 4 m depth is plotted in gray bars. The final sediment trap deployment ended 31 May. The capped line (top) spans the IFCB observation period.
