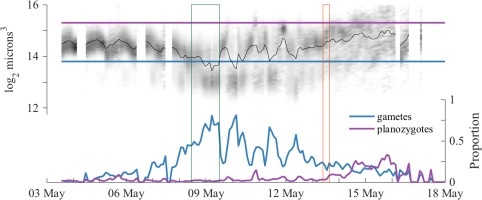
Figure 5.

A. catenella singlet size dynamics and partitioning of the population into gamete and mature planozygote size classes. Green and orange rectangular outlines denote intervals when IFCB step‐profiling studies were conducted. Upper panel: Singlet cell volume distribution is presented as a gray scale histogram at each sample time. Darker shades represent a larger proportion of cells having the given size than lighter shades. These size dynamics are overlain by the 2‐h moving window mean of cell volume (black line). Horizontal lines defining gamete and planozygote size thresholds are drawn in blue and purple, respectively. Bottom panel: Partitioning of the A. catenella population into gamete and mature planozygote size classes.
