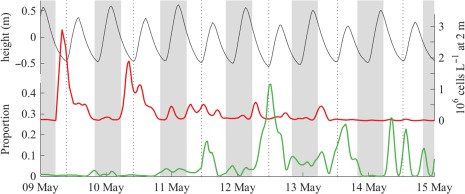
Figure 6.

Association of daytime flood tides with drops in cell abundance detected by the IFCB at 2 m below the pond's surface (red line, right vertical axis) and spikes in the prevalence of mature Amoebophrya infections (green line, lower left vertical axis). Nighttime periods are indicated by vertical gray bars and dotted rules mark the timing of daytime low tides. Water level (black line) is plotted against the upper left vertical axis.
