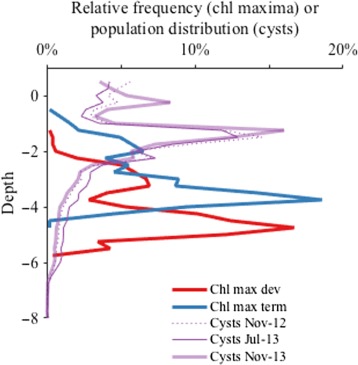
Figure 10.

Depths occupied by A. catenella planktonic and benthic stages derived from fluorescence profiles and spatial surveys of cyst abundance. Red and blue lines describe the relative frequency of chlorophyll maximum water depths (i.e., where planktonic stages were most concentrated) during the last 4 d of the bloom's development (05–09 May) and its termination phase (09–13 May), respectively. Purple lines describe the population distributions of cysts collected at corresponding bottom depths: one pre‐bloom (November 2012) and two post‐bloom (July and November 2013).
