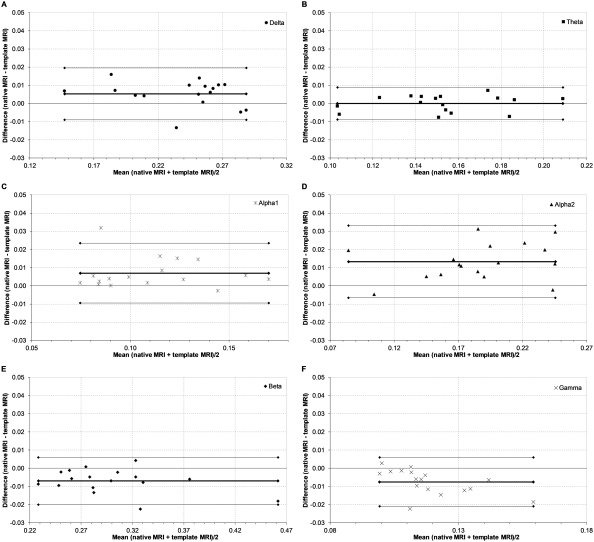
Figure 5.

Bland–Altman plots of global relative power. Bland–Altman plots of the respective difference in global relative power across subjects (n = 17) between the template MRI and the native MRI for each individual against their respective means. Thin lines represent the limits of agreement corresponding to ±1.96 SD. The thick line represents the respective mean. Panels indicate frequency bands: A, delta band; B, theta band; C, lower alpha band; D, upper alpha band; E, beta band; F, gamma band.
