
Figure 1.
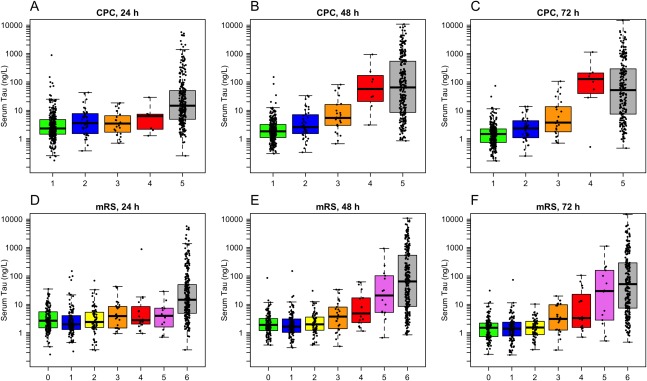
Serum tau concentrations by neurological outcome at 6 months. (A–C) Cerebral Performance Categories (CPC). At 24 hours, CPC 5 had higher tau than CPC 1–3 (p < 0.0001; the difference vs CPC 4 was not significant after correction for multiple comparisons, p = 0.073). At 48 hours, CPC 5 had higher tau than CPC 1–3 (p < 0.0001), CPC 4 had higher tau than CPC 1–2 (p ≤ 0.0001) and CPC 3 (p = 0.011), and CPC 3 had higher tau than CPC 1 (p = 0.002). At 72 hours, CPC 5 had higher tau than CPC 1–3 (p < 0.0001), CPC 4 had higher tau than CPC 1–3 (p < 0.0001 for CPC 1–2 and p = 0.0013 for CPC 3), and CPC 3 had higher tau than CPC 1 (p = 0.0003). (D–F) Modified Rankin scale (mRS). At 24 hours, mRS 6 had higher tau than all other groups (p < 0.0001 for mRS 0–3, p = 0.004 for mRS 4, p = 0.002 for mRS 5). At 48 hours, mRS 6 had higher tau than mRS 0–4 (p < 0.0001), mRS 5 had higher tau than mRS 0–2 (p ≤ 0.0001) and mRS 3 (p = 0.025), and mRS 4 had higher tau than mRS 0 (p = 0.041) and mRS 1 (p = 0.038). At 72 hours, mRS 6 had higher tau than mRS 0–4 (p < 0.0001), mRS 5 had higher tau than mRS 0–2 (p < 0.0001) and mRS 3 (p = 0.012), and mRS 4 had higher tau than mRS 0–2 (mRS 0, p = 0.010; mRS 1, p = 0.012; mRS 2, p = 0.024). All differences were tested by linear regression with log10‐transformed tau data, adjusted for age and sex. Probability values were adjusted for multiple comparisons using Hochberg correction (1 correction at every time point for CPC [n = 10 tests at each time point] and mRS [n = 21 tests at each time point]).