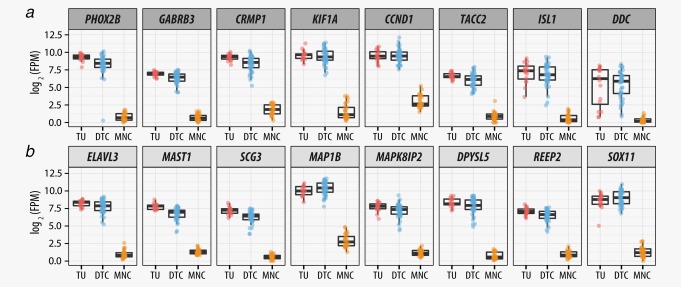
Figure 4.

Differentially expressed genes in tumor, DTC and MNC samples. (a) Expression of MRD marker in the BM of neuroblastoma patients that are known from the literature.27 (b) The top eight upregulated genes in DTCs as compared to the corresponding MNCs. Abbreviation: FPM: fragments per million. [Color figure can be viewed at wileyonlinelibrary.com]
