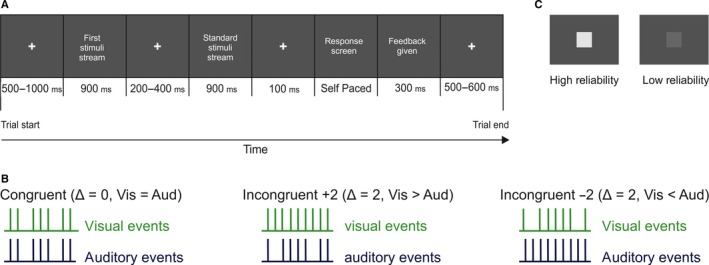
Figure 1.

Experimental set‐up. (A) Subjects were presented with two sequential streams of auditory, visual and/or audio‐visual events and had to indicate which stream contained more events. The first stream varied in modality, event rate, reliability and congruency of the events (see Materials and methods). (B) Schematic showing one combination for each level of congruency (left: equal rates, middle: auditory fewer events, right: auditory more events). Δ = Visual − Auditory rate. (C) Example of high and low‐reliability visual stimuli. [Colour figure can be viewed at wileyonlinelibrary.com].
