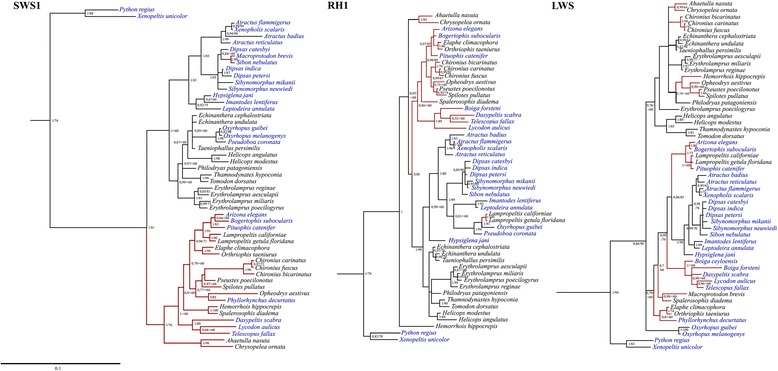
Fig. 1.

Results of phylogenetic analyses of the nucleotide sequences of the SWS1, RH1, and LWS snake opsin genes, constructed by Maximum Likelihood (ML). Primarily diurnal species are represented in black, and not primarily diurnal species are represented in blue. The brown lines and the black lines represent species from the Colubrinae and the Dipsadinae subfamilies, respectively. ML bootstrap support and BI posterior probability are indicated for each resolved internal branch, in the order ML/BP. Values below 0.7/60 are not depicted. The species used as outgroup are listed in Additional file 1: Table S2. Scale bars represent the number of nucleotide substitutions per site
