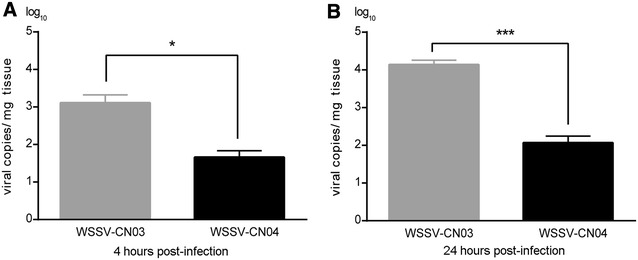
Figure 4.

qPCR analysis of the infection of WSSV-CN03 and -CN04 in juvenile L. vannamei. L. vannamei were randomly divided into three groups. Each shrimp was fed with 2 mg WSSV-CN03-infected tissue or WSSV-CN04-infected tissue. The shrimp in the control group were fed with WSSV-free tissue. For each group, at 4 hpi and 24 hpi, 5 shrimp were randomly selected for q-PCR analysis. The columns represent the log base 10 of the mean WSSV copy numbers of 5 shrimp in each group, and the standard deviations were calculated. The data were subjected to independent-sample t test as indicated in figure. *P < 0.05; ***P < 0.001. The experiment was repeated three times and representative results from one experiment are shown.
