
Figure 2.
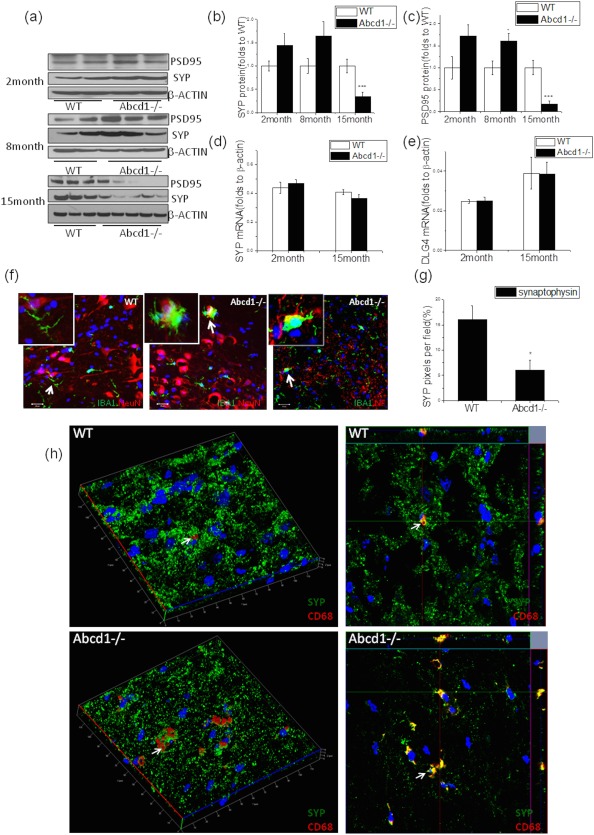
The presence of synapse loss, a marker of axon degeneration at different ages in Abcd1–/– mice spinal cord. (A) Representative western blot showed presynaptic synaptophysin (SYP) and postsynaptic PSD95 expression in Abcd1–/– spinal cord across different ages and (B) synaptophysin as well as (C) PSD95 protein quantification using ImageJ (NIH, Bethesda, MD) with β‐actin as loading control (n = 4 at 2 months, n = 5 at 8 months, and n = 12 at 15 months). (D) Synaptophysin (SYP) and (E) PSD95 (DLG4) gene expression in Abcd1–/– spinal cord at different ages (n = 4 at 2 months and n = 12 at 15 months). (F) Costaining of IBA1 (green) and NeuN (red) as well as neurofilament (NF; red) shows activated microglia surrounding neurons and neurites in 15‐month‐old Abcd1–/– mouse spinal cord. (G) Immunofluorescence quantification of synaptophysin pixels in 15‐month‐old spinal cord using ImageJ (n = 7). (H) Three‐dimensional confocal images show microglia (CD68 red) engulfing synapses (synaptophysin green) in 15‐month‐old mouse spinal cord (indicated by white arrow). In wild‐type spinal cord, more punctate synaptophysin staining is present compared to the Abcd1–/– spinal cord where synapse loss occurs. Data are expressed as mean ± SEM; *p < 0.05; ***p < 0.001. DLG4 = disks large homolog 4; IBA1 = ionizing calcium‐binding adaptor molecule 1; PSD95 = postsynaptic density protein 95; NeuN = neuronal nuclei; SEM = standard error of the mean; WT = wild type.