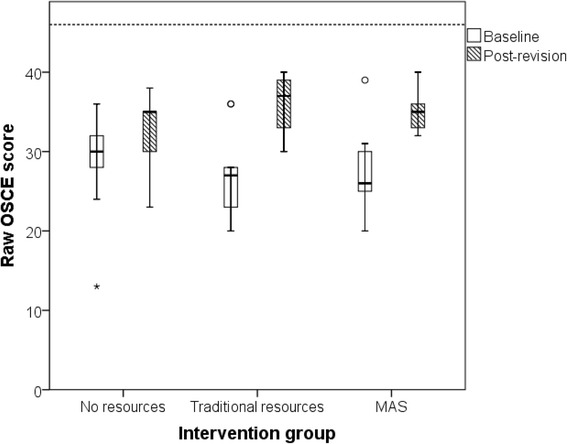
Fig. 5.

Distribution of raw OSCE scores at baseline and after 1-h spent with specified revision resources. Box and whisker plots display median and IQR values. Circular data points indicate outliers; asterisk indicates severe outlier. Dashed horizontal line depicts maximum achievable score of 46 marks (n = 9 per group). All students included in main analysis
