FIGURE 5.

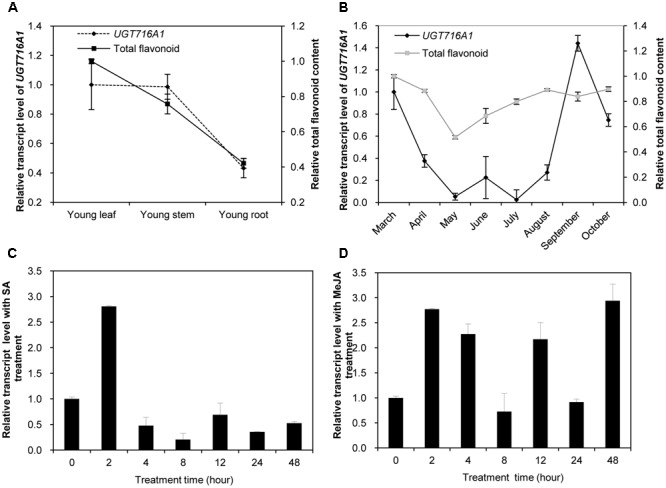
Relative transcript levels of UGT716A1 and flavonoid content in G. biloba. (A,B) Relative transcript levels of UGT716A1 and flavonoid content in various tissues (A) and leaves at different seasons (B) of G. biloba. The total flavonoids were relatively quantified with standard curve of quercetin, and 34.8 μg quercetin/mg dry weight in leaves of April was set as value of 1 in B. (C,D) Relative transcript level of UGT716A1 after SA (C) and MeJA (D) treatment of G. biloba suspension cells. Transcripts were detected by qRT-PCR. Values show the means and standard deviations of analytical triplicates.
