Fig. 1.

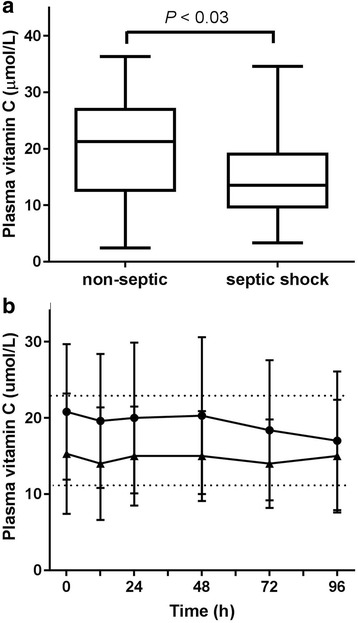
Plasma vitamin C concentrations in critically ill patients. a Septic shock patients had significantly lower vitamin C concentrations than non-septic patients (P < 0.03 using linear mixed effects model). Box plots show median with 25th and 75th percentiles as boundaries, and whiskers are the range. b Time course of plasma vitamin C concentrations in the non-septic group (filled circles) and the septic shock group (filled triangles). Data represent mean and SD. Dotted lines indicate the hypovitaminosis C cutoff (23 μmol/L) and vitamin C deficiency cutoff (11 μmol/L)
