
Fig. 1.
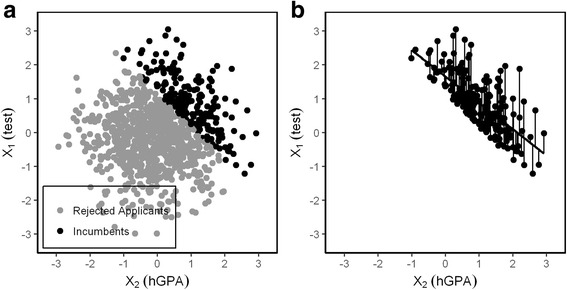
a Scattergram of X1 and X2. 20% of 1000 applicants are selected by the sum of X1 and X2; the circular cloud representing all applicants is divided by a diagonal line that separates the top right area from the bottom left area. b This generates a negative correlation between X1 and X2 in the incumbents . Residuals of X1 after the linear effect of X2 is removed. They are expressed as deviations from the regression line: The residuum of X1 when the influence of X2 is removed is the observed X1 value minus the expected value of the regression X1 on X2