
Fig. 4.
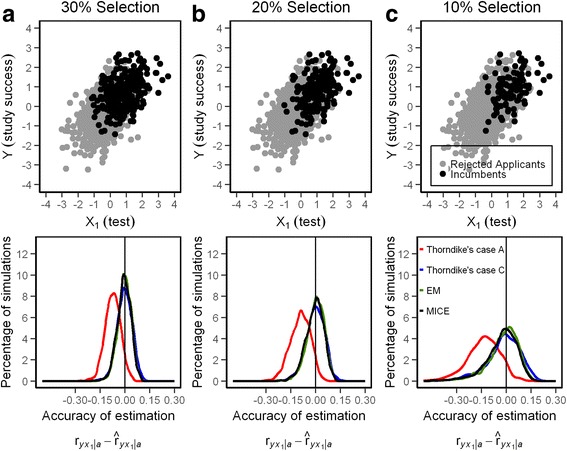
a-c Scattergram of Y (study success) with X1 (test results) and precision of the estimation of (predictive validity) from different methods when 30%, 20%, and 10% of applicants are selected
Official websites use .gov
A
.gov website belongs to an official
government organization in the United States.
Secure .gov websites use HTTPS
A lock (
) or https:// means you've safely
connected to the .gov website. Share sensitive
information only on official, secure websites.
a-c Scattergram of Y (study success) with X1 (test results) and precision of the estimation of (predictive validity) from different methods when 30%, 20%, and 10% of applicants are selected