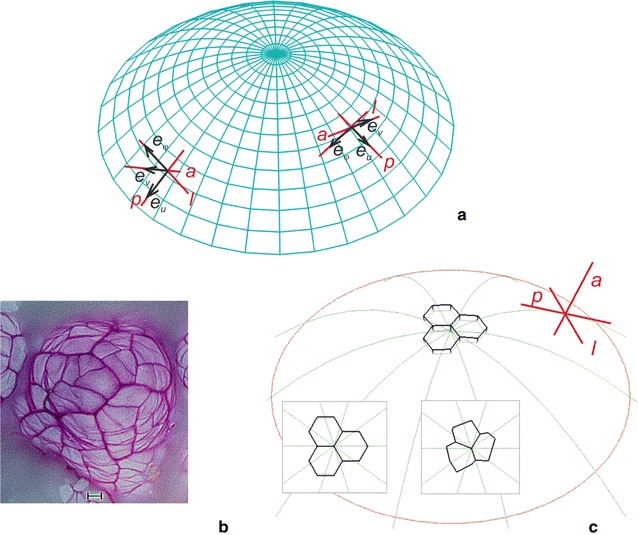
Fig. 1.

The shoot apical dome modeled in this paper and the cells assumed to be initials of the surface cell layer: a the dome surface visualized by the coordinate lines of the paraboloidal system (u, v, φ); at the exemplary point unit vectors e u, e v, e φ, respectively, represent three mutually orthogonal directions: p-periclinal, a-anticlinal, l-latitudinal; b Picea abies microphotograph showing a triad-type cellular pattern with clear apical initials observed in a seedling at the age of about 12 plastochrons [65], c position of the exemplary initials at the dome summit and two triads of the initials composed of the uniform and not uniform cells (insert shows top view) assumed in the modeling. At the dome surface meridional growth trajectories (green), the p, a, l directions (red) and the boundary of the simulation area at the dome base (brown) are indicated
