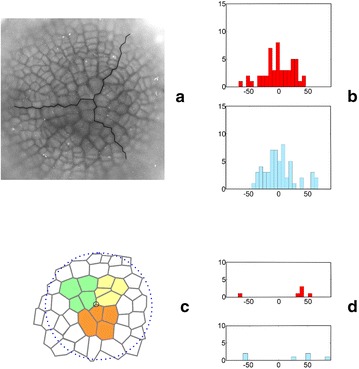
Fig. 10.

Comparing of the simulation results to empirical data a Picea abies microphotograph coming from surface cell pattern of the shoot apex of the tree several years of age (Nakielski—unpublished materials); the most likely boundaries between three clonal sectors are indicated, b diagrams of angular variation of the cell walls forming the zigzag boundaries between sectors in the real (top, data from a) and virtual (down, data from Fig. 6a) shoot apex, c the surface cell pattern in the central region of the Arabidiopsis shoot apex (redrawn from Willis et al. [42]); three cell tetrads that meet at the point which may correspond to the dome tip are marked, d diagrams as in b but showing angular variation of division walls formed by potential initials of the real apex (top, data from c) and initial cell of the virtual apex (down, data from t9 in Fig. 7a). For a given wall seen in the top view its angle with respect to the radius was measured
