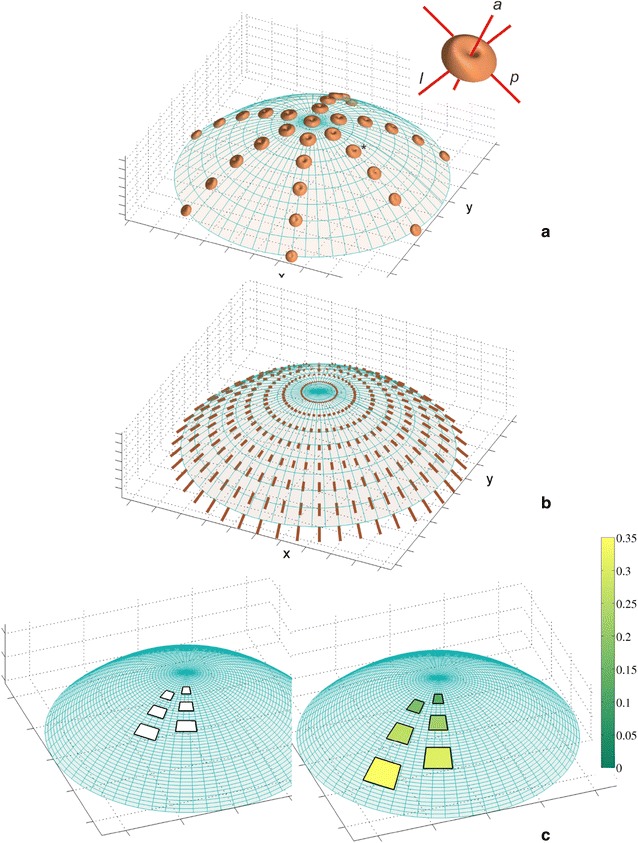
Fig. 2.

The growth field assumed for the apical dome surface: a distribution of the relative elemental rate of the linear growth (Rl) visualized by the 3D indicatrices; at each point, the value of Rl in a given direction is proportional to the distance from the point to the indicatrix surface along this direction; the insert shows the orientation of the exemplary indicatrix (asterisk) with respect to the directions p, a, l—notice the isotropic surface growth (values of Rl in the plane tangent to the surface are the same). b The displacement velocity field, the V vectors are represented line segments; c the deformation of exemplary rectangles during growth, the relative rate of growth in area is color-coded. The surface growth decreased basipetally simultaneously causing an increase in both the V and the relative rate of growth in the area
