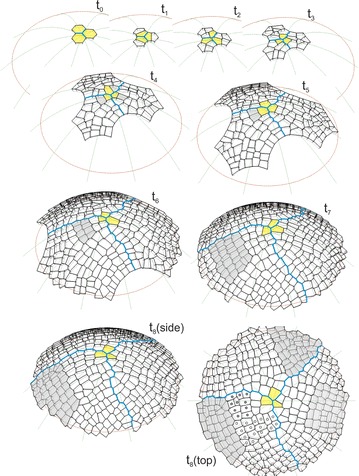
Fig. 4.

The computer-generated sequence of the formation of the surface cell layer of the apical dome. In the model the uniform initials (In1) and divisions with the SAD rule in mode I were assumed. The times from t 0 to t 8 (side view) show the development of the cell pattern; the apical initials (yellow), zigzag boundaries between sectors (blue) and one of cellular clones (gray) formed in the frontal sector are marked. At t 8 (top view) the other clones considered in the text are indicated with respect to the previous one, those in the frontal sector (open and closed circles) are younger and those in the remaining sectors (gray) are similar in age
