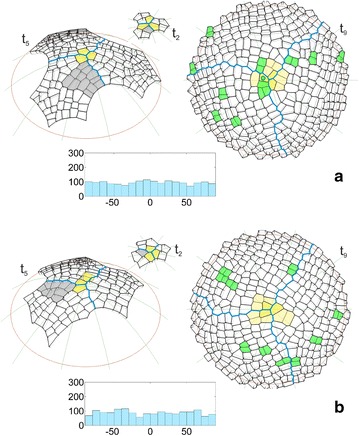
Fig. 5.

Selected times showing the results of two simulations in which the surface cell layer originated from a uniform or b not uniform apical initials, assuming cell divisions with the SAD rule in mode I in both. Times t2 and t5 (side view) like in Fig. 4, t9 (top view) shows a further developmental stage that was not considered earlier. In the cell pattern there are marked: the apical initials (yellow), the boundaries between the sectors (blue) and the cellular clone initiated at t2 by the initial sister (gray). At t9, the cell divisions are indicated in the apical initials (the light yellow cell packet formed by the two final self-renewing cells) and other cells (green) during the following 20 time-steps at the end of the simulation. The diagrams shows the angular distribution of all of the division walls (top view, where 0° and 90°, respectively, represent meridional and latitudinal orientations)
