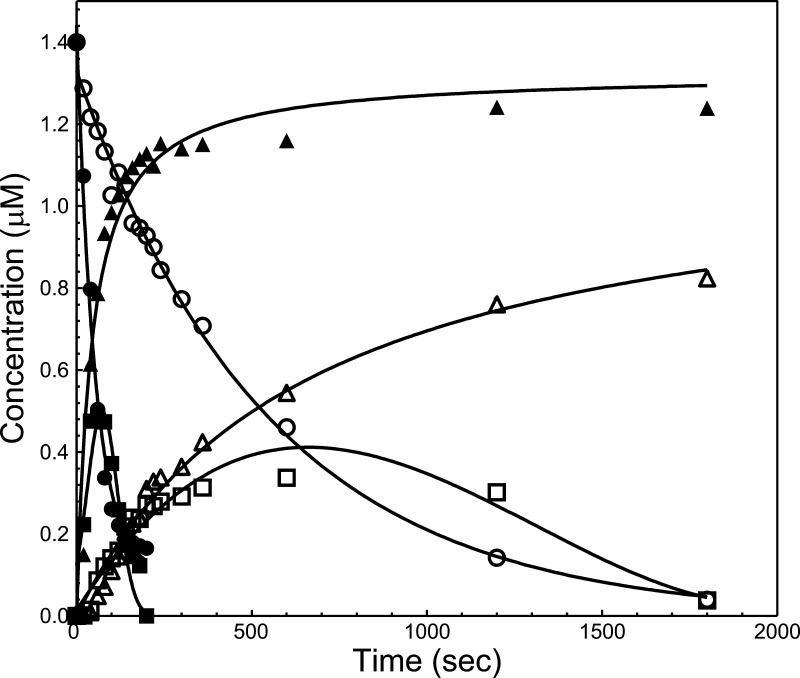
Figure 4.
Reaction profiles for the activation of hPro by prothrombinase. Progress curves for products and reactants for the activation of hPro by prothrombinase assembled with rhfVaWT (filled symbols) or rhfVaNR→DE (open symbols) were obtained by quantitative densitometry of the gels shown in Figure 3A,B, as described in the Experimental Section. The graphs illustrate the disappearance of hPro (circles), the transient formation of MzT (squares), and the accumulation of the B chain of α-thrombin (triangles). The lines for the disappearance of hPro were drawn according to the equation of a one phase exponential decay (rhfVaWT, R2 = 0.99, and rhfVaNR→DE, R2 = 0.99). The lines depicting the formation of MzT and the accumulation of the B chain of α-thrombin were arbitrarily drawn. Additional data points extending to 1 h of incubation have been omitted for clarity.

