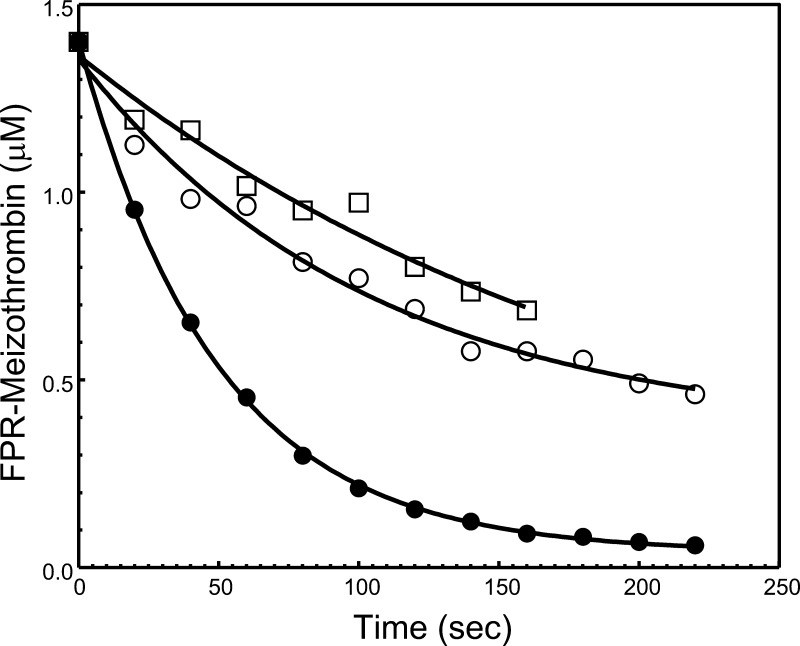
Figure 8.
Analysis of FPR-MzT consumption by prothrombinase assembled with rhfVa molecules. The gels shown in Figure 7 were scanned and FPR-MzT consumption was recorded as described in the Experimental Section. Following scanning densitometry, the data representing FPR-MzT consumption as a function of time (s) were plotted using nonlinear regression analysis according to the equation representing a first-order exponential decay using the software Prizm (GraphPad, San Diego, CA), as described in the Experimental Section. The apparent first-order rate constant k (s–1) was obtained directly from the fitted data. Prothrombinase was assembled with rhfVaWT (filled circles) or rhfVaNR→DE (open circles); factor fXa alone cleavage of FPR-MzT is shown by the open squares. The resulting numbers representing FPR-MzT consumption are reported in Table 2.

