
Fig. 7.
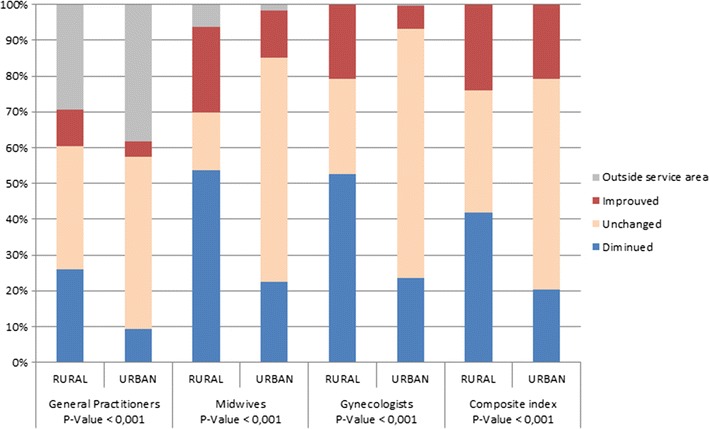
Percentage of Urban/Rural IRIS having improved/unchanged/deteriorated accessibility. ISA variation with edge problem corrected. The p value is determined by Chi-square test
Official websites use .gov
A
.gov website belongs to an official
government organization in the United States.
Secure .gov websites use HTTPS
A lock (
) or https:// means you've safely
connected to the .gov website. Share sensitive
information only on official, secure websites.
Percentage of Urban/Rural IRIS having improved/unchanged/deteriorated accessibility. ISA variation with edge problem corrected. The p value is determined by Chi-square test