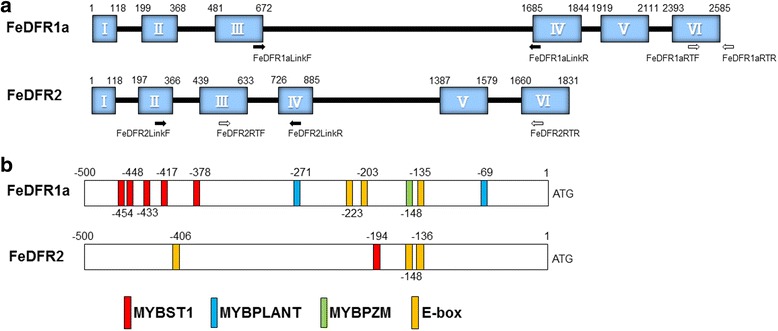
Fig. 2.

Structures of the FeDFR1a and FeDFR2 genes. a Coding regions (boxes) and introns (lines). Numbers inside the boxes represent the number of the exons. Numbers above the boxes indicate the initial and final positions of the exons. Arrows indicate PCR primers used for linkage analysis and open arrows indicate PCR primers used for real-time PCR analysis. b Schematic representation of motifs that bind to transcription factors in the promoter regions. Numbers indicate the positions of the motifs. Motifs: MYBST1, GGATA; MYBPLANT, MACCWAMC; MYBPZM, CCWACC; E-box, CANNTG
