
Fig. 6.
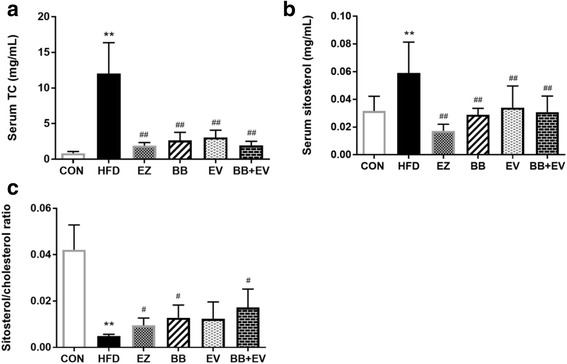
Serum total cholesterol (a), serum sistosterol (b), and the ratio of sistosterol by cholesterol (c) measured by gas chromatography in hyperlipidemic rat. Data are represented as mean ± SD with 10 samples each group. *P < 0.05,**P < 0.01 compared with Control; #P < 0.05,##P < 0.01 compared with Model (ANOVA with Dunnett’s post-hoc test)