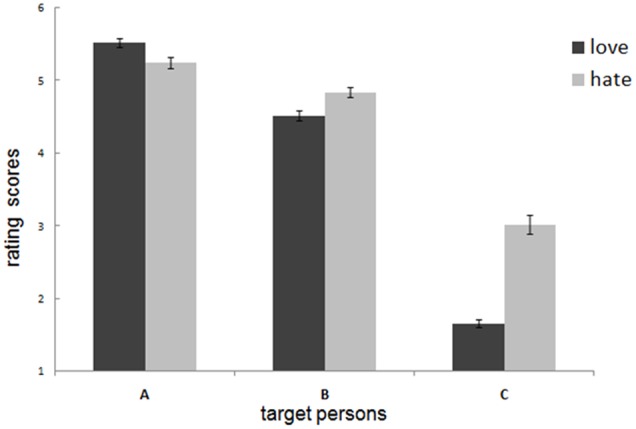
FIGURE 3.

The love and hate level of all participants in response to the 3 (targets: A, B, C) × 2 (affect: love, hate) two-ways repeated measures ANOVA revealed a significant target × affect interaction. Error bars represent +1 standard error (SE). Participants’ degree of love for A (excellent and high similarity with the participants) was still higher than hate after negative events occurred, but the tendency for B (excellent and moderate similarity) and C (low excellence and low similarity) is opposite.
