
Figure 2.
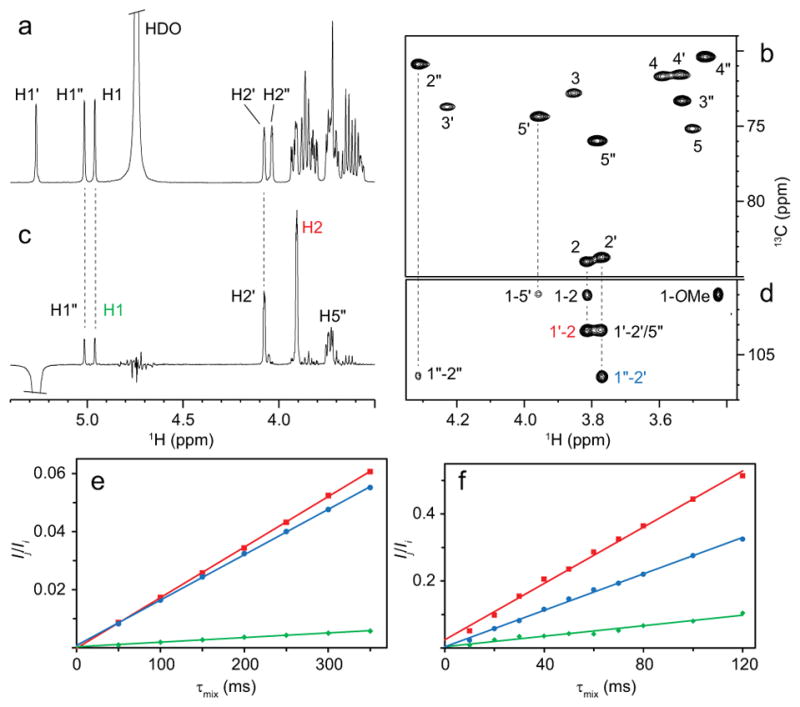
(a) 1H NMR spectrum of Man3 in D2O buffer. (b) Selected region of the 1H,13C-CT-HSQC spectrum of Man3 bound to CV-N. (c) 1D 1H,1H-DPFGSE-T-ROESY spectrum of Man3 with selective excitation on H1″ and a mixing time of 300 ms. (d) Selected region of a 1H,13C-HSQC-NOESY spectrum of CV-N-bound Man3 with a mixing time of 60 ms. (e-f) PANIC plots of Ij/Ii versus τmix, where Ij is the intensity of the NOE peak, -Ii is the intensity of the target peak (selective experiments) and Ii is the average intensity of the diagonal peaks (2D experiments). Plots are shown for H1″-H2 (red squares), H1′-H2″ (blue circles), and H1-H1″ (green diamonds) of (e) free and (f) bound Man3. Cross-relaxation rates were obtained from the slopes of the lines.