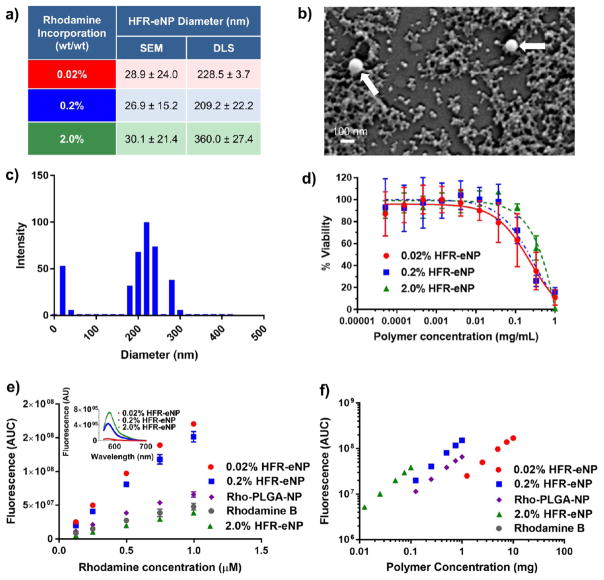
Figure 1.
Characterization of HFR-eNPs. (a) Nanoparticle diameter as a function of rhodamine incorporation as measured by SEM and DLS. (b) SEM image of 0.2% HFR-eNPs; white arrows indicate two larger particles on a background of many 20–50 nm particles. (c) Representative DLS data of 0.2% HFR-eNPs. (d) Viability of Panc-1 cells treated with HFR-eNPs as measured using an MTS assay. (e) Area under the curve (AUC) of the fluorescence emission spectra of HFR-eNPs, Rho-PLGA-NPs, and free rhodamine B as a function of rhodamine concentration in 10 mM pH 7.4 phosphate buffer. Inset: Fluorescence emission spectra of the HFR-eNPs at equivalent polymer concentrations. (f) AUC of the fluorescence emission spectra of HFR-eNPs and Rho-PLGA-NPs as a function of polymer concentration in 10 mM pH 7.4 phosphate buffer.

