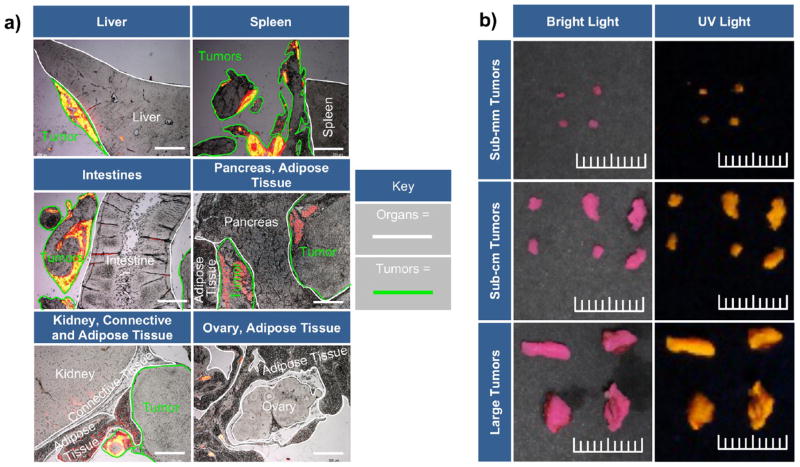
Figure 5.
Localization of HFR-eNPs to tumors. (a) Representative histological analysis using merged images of rhodamine fluorescence (yellow/orange/red color) and bright light images of tumors and adjacent normal tissues. Scale bars are 1 mm. (b) Bright light and UV images of tumors resected from a xenograft Panc1-CSC rat model. Tumors range from sub-millimeter to approximately 1 cm in size. Scale bar shows 1 cm with millimeter delineations.

