Figure 4.

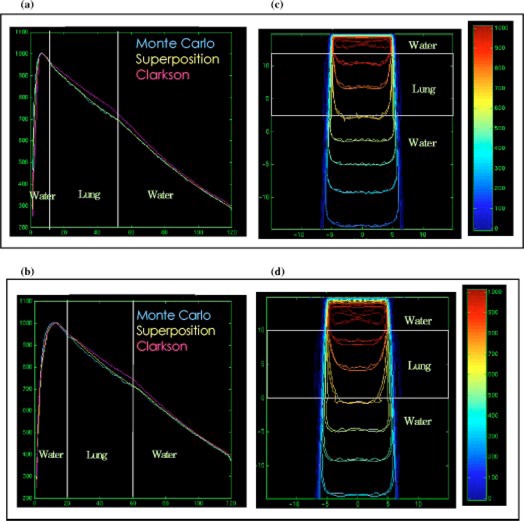
(Color) Depth dose distributions for the Clarkson, MGS, and beam in the lung phantom, (a) , 6‐MV beam, (b) , 15‐MV beam. Isodose distributions for the MGS and beam along a central‐axis transverse plane, (c) , 6‐MV beam, (d) , 15‐MV beam.

(Color) Depth dose distributions for the Clarkson, MGS, and beam in the lung phantom, (a) , 6‐MV beam, (b) , 15‐MV beam. Isodose distributions for the MGS and beam along a central‐axis transverse plane, (c) , 6‐MV beam, (d) , 15‐MV beam.