Figure 2.

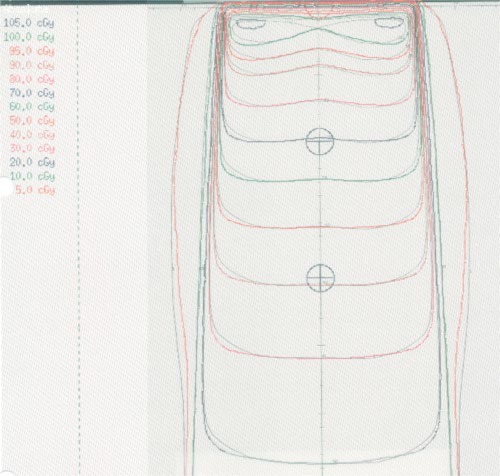
(Color) Isodose distributions for a open field. The calculated dose distribution is indicated in color, and the measured dose distribution is indicated in black and white.

(Color) Isodose distributions for a open field. The calculated dose distribution is indicated in color, and the measured dose distribution is indicated in black and white.