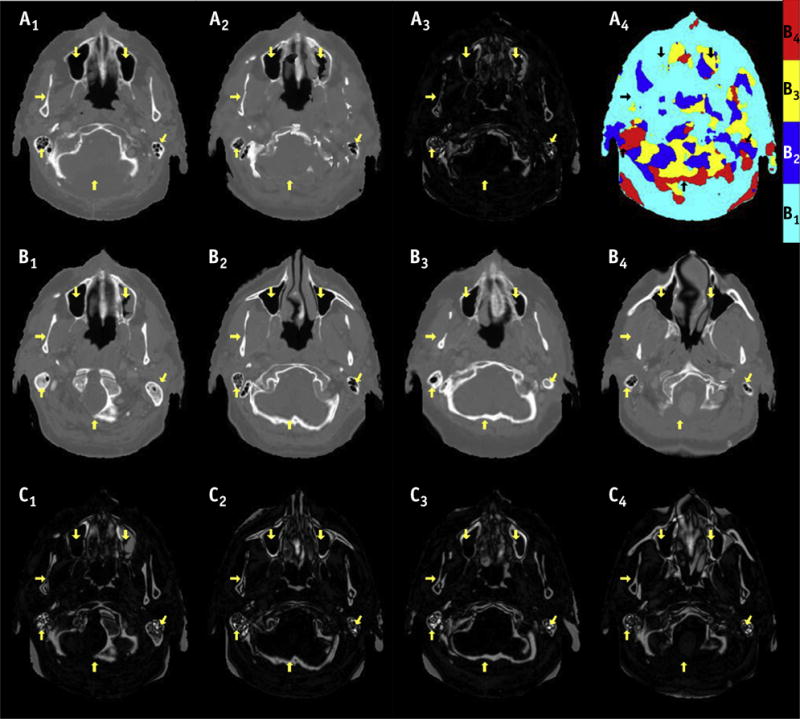
Fig. 2.

Axial images of true computed tomography (CT) (A1) of a test patient, composite atlas and difference image from true CT (A2–3), and color map (A4) indicating composite atlas was generated from multiple atlases. The original atlas CT and difference from true CT images are shown in B1–4 and C1–4, respectively. The arrows point to the regions where one of the original atlases has similar appearance with the true CT. Overall, large anatomic variations can be observed between original atlases and true CT (C1–4), which are significantly reduced using the composite atlas (A3).
