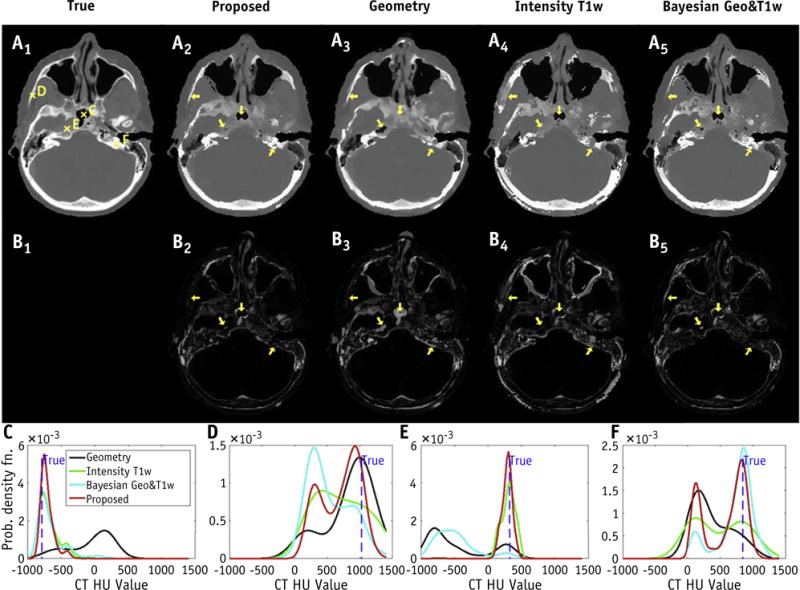
Fig. 3.

Axial images of true computed tomography (CT) for a test patient, and estimated synthetic CT using the proposed, geometry, T1-weighted (T1w) intensity, and our previous Bayesian approaches (first row A1–5). The difference images from true CT are shown in the second row (B1–5). Arrows indicate the regions where conventional approaches failed to identify the correct tissue. Probability density functions of the proposed approach correctly identified the electron density at all voxels (C, D, E, and F), with true value indicated as dashed vertical line. On the other hand, conventional approaches based on geometry (C, E, and F), T1w intensity (D and F), and our previous Bayesian approach (D and E) produced erroneous estimations (last row). Abbreviation: HU = Hounsfield unit.
